ThirdEye
Introduction
About ThirdEye
ThirdEye is an integrated tool for realtime monitoring of time series and interactive root-cause analysis. It enables anyone inside an organization to collaborate on effective identification and analysis of deviations in business and system metrics. ThirdEye supports the entire workflow from anomaly detection, over root-cause analysis, to issue resolution and post-mortem reporting.
What is it for? (key features)
Online monitoring and analysis of business and system metrics from multiple data sources. ThirdEye comes batteries included for both detection and analysis use cases. It aims to minimize the Mean-Time-To-Detection (MTTD) and Mean-Time-To-Recovery (MTTR) of production issues. ThirdEye improves its detection and analysis performance over time from incremental user feedback.
Detection * Detection toolkit based on business rules and exponential smoothing * Realtime monitoring of high-dimensional time series * Native support for seasonality and permanent change points in time series * Email alerts with 1-click feedback for automated tuning of detection algorithms
Root-Cause Analysis * Collaborative root-cause analysis dashboards * Interactive slice-and-dice of data, correlation analysis, and event identification * Reporting and archiving tools for anomalies and analyses * Knowledge graph construction over time from user feedback
Integration * Connectors for continuous time series data from Pinot and CSV * Connectors for discrete event data sources, such as holidays from Google calendar * Plugin support for detection and analysis components
What isn’t it? (limitations)
ThirdEye maintains a dedicated meta-data store to capture data sources, anomalies, and relationships between entities but does not store raw time series data. It relies on systems such as Pinot, RocksDB, and Kafka to obtain both realtime and historic time series data.
ThirdEye does not replace your issue tracker - it integrates with it. ThirdEye supports collaboration but focuses on the data-integration aspect of anomaly detection and root-cause analysis. After all, your organization probably already has a well-oiled issue resolution process that we don’t want to disrupt.
ThirdEye is not a generic dashboard builder toolkit. ThirdEye attempts to bring overview data from different sources into one single place on-demand. In-depth data about events, such as A/B experiments and deployments, should be kept in their respective systems. ThirdEye can link to these directly.
Quick Start
ThirdEye supports an interactive demo mode for the analysis dashboard. These steps will guide you to get stepsarted.
1: Prerequisites
You’ll need Java 8+, Maven 3.6+, and NPM 3.10+
2: Build ThirdEye
git clone https://github.com/apache/incubator-pinot.git
cd incubator-pinot/thirdeye
chmod +x install.sh run-frontend.sh run-backend.sh reset.sh
./install.sh
Note: The build of thirdeye-frontend may take several minutes
3: Run frontend
./run-frontend.sh
4: Start an analysis
Point your favorite browser to
http://localhost:1426/app/#/rootcause?metricId=1
Note: ThirdEye in demo mode will accept any credentials
You will find the root cause analysis page like below:

5: Have fun
Available metrics in demo mode are:
- business::puchases
- business::revenue
- tracking::adImpressions
- tracking::pageViews
Note: These metrics are regenerated randomly every time you launch ThirdEye in demo mode
We also have 2 real world metric with seasonality in H2 database, for detection experimentation:
- H2::daily (From: https://www.kaggle.com/marklvl/bike-sharing-dataset)
- H2::hourly (From: https://www.kaggle.com/robikscube/hourly-energy-consumption)
6: Run detection preview
A detection preview let you see how the detection configuration performs on past data.
Copy the following into the detection configuration:
detectionName: name_of_the_detection
description: If this alert fires then it means so-and-so and check so-and-so for irregularities
metric: value
dataset: H2.H2.daily
rules:
- detection:
- name: detection_rule_1
type: HOLT_WINTERS_RULE
params:
sensitivity: 8
Click Run Preview button, the anomalies will be detected. Then you can play around with different time frames.
You will find the alert preview page like below:
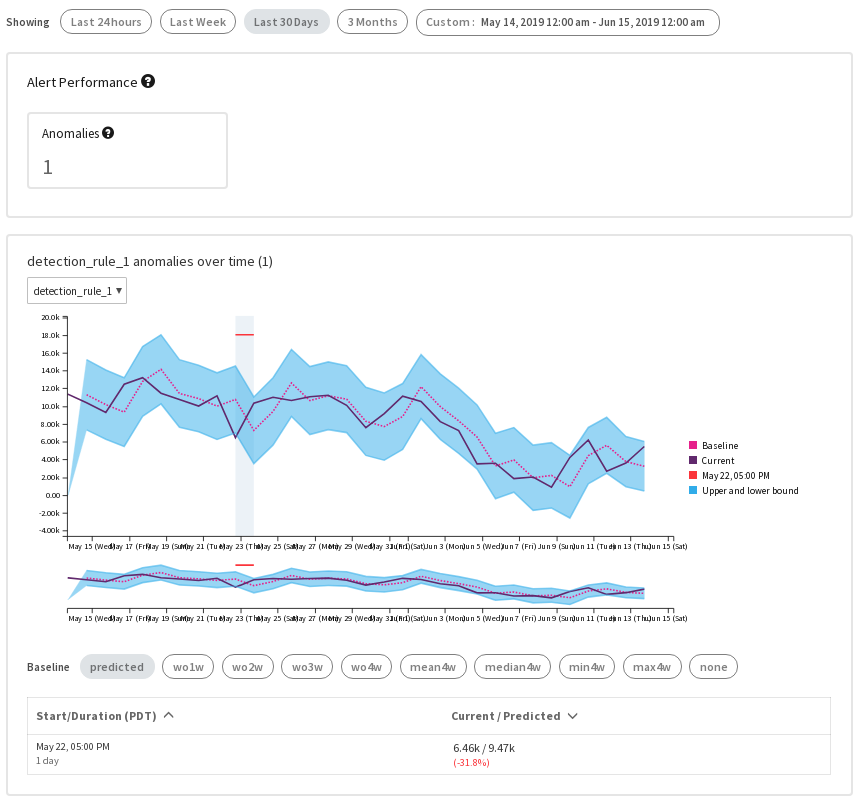
If you want to preview the hourly data, just change dataset: H2.H2.daily to dataset: H2.H2.hourly, and rerun the preview.
If you want to setup in production, you need to see Configuration and Alert Setup.
7: Shutdown
You can stop the ThirdEye dashboard server anytime by pressing Ctrl + C in the terminal
Getting Started
This document will help you set up ThirdEye(abbreviated as ‘TE’) with an external MySQL persistence layer. It will also demonstrate how to plugin your own datasets from custom datasources.
Prerequisites
You’ll need Java 8+, Maven 3.6+, and NPM 3.10+
Warning
On MacOS, Java 8 is the recommended version. Higher versions of JDK including Java 9 and Java 14 are known to have issues.
Building ThirdEye from source
Simply clone the repo and build using the set of commands below.
git clone https://github.com/apache/incubator-pinot.git
cd incubator-pinot/thirdeye
chmod +x install.sh run-frontend.sh run-backend.sh reset.sh
./install.sh
Note
The build of thirdeye-frontend may take several minutes
Configuration
ThirdEye is extremely flexible in terms of storage and working with different persistence layers and data sources. In this document, we’ll set it up using MySQL as the main persistence layer.
By default, ThirdEye assumes ./config as the main config directory relative to the current
working dir. The configurations use the YAML file format.
MySQL Persistence
Note
This section assumes that you have a running MySQL server available with admin privileges.
Step 1. Create a Database for ThirdEye
-- Create DB
CREATE DATABASE thirdeye_test
DEFAULT CHARACTER SET utf8mb4
DEFAULT COLLATE utf8mb4_unicode_ci;
Step 2. Setup users with appropriate privileges.
This assumes that you have an admin user and an app user. The app user is more restrictive in terms of its privileges. You can also create a single user to do all operations.
-- Create admin user
CREATE USER 'uthirdeyeadmin'@'%' IDENTIFIED BY 'pass';
GRANT ALL PRIVILEGES ON thirdeye_test.* TO 'uthirdeyeadmin'@'%' WITH GRANT OPTION;
-- Create app user
CREATE USER 'uthirdeye'@'%' IDENTIFIED BY 'pass';
GRANT SELECT, INSERT, UPDATE, DELETE, EXECUTE ON thirdeye_test.* TO 'uthirdeye'@'%';
Step 3. Create the tables in the ThirdEye Database
Login to your MySQL database and run the script below.
mysql -h localhost -u uthirdeye thirdeye_test -p < thirdeye-pinot/src/main/resources/schema/create-schema.sql
Step 4. Update the persistence config file
ThirdEye stores it’s persistence config in the file below.
./config/persistence.yml
For demo purposes, TE uses an in memory H2 db by default. To use MySQL, change the file contents with the one shown below.
databaseConfiguration:
# Assuming a local MySQL server running on the default port 3306
url: jdbc:mysql://localhost/thirdeye_test?autoReconnect=true
user: uthirdeye
password: pass
driver: com.mysql.jdbc.Driver
All set! ThirdEye is now configured to use MySQL as the persistence layer.
Running ThirdEye
You can use the command below to run ThirdEye assuming your working dir to be ./thirdeye
./run-frontend.sh
Note
You can stop the ThirdEye dashboard server anytime by pressing Ctrl+C in the terminal
Creating an Application
See Application. We’ll be using this application when creating alerts.
Setting up Alerts
You can set up alerts and do root cause analysis on this application. See more at Alert Setup.
Application
An application is a basic TE entity can serves as a container for metrics, alerts and other entities. It also can be used to group a bunch of users.
Creating an Application
You can create an Application in ThirdEye using 2 ways: 1. ThirdEye Admin 2. Using the API
From ThirdEye Admin UI
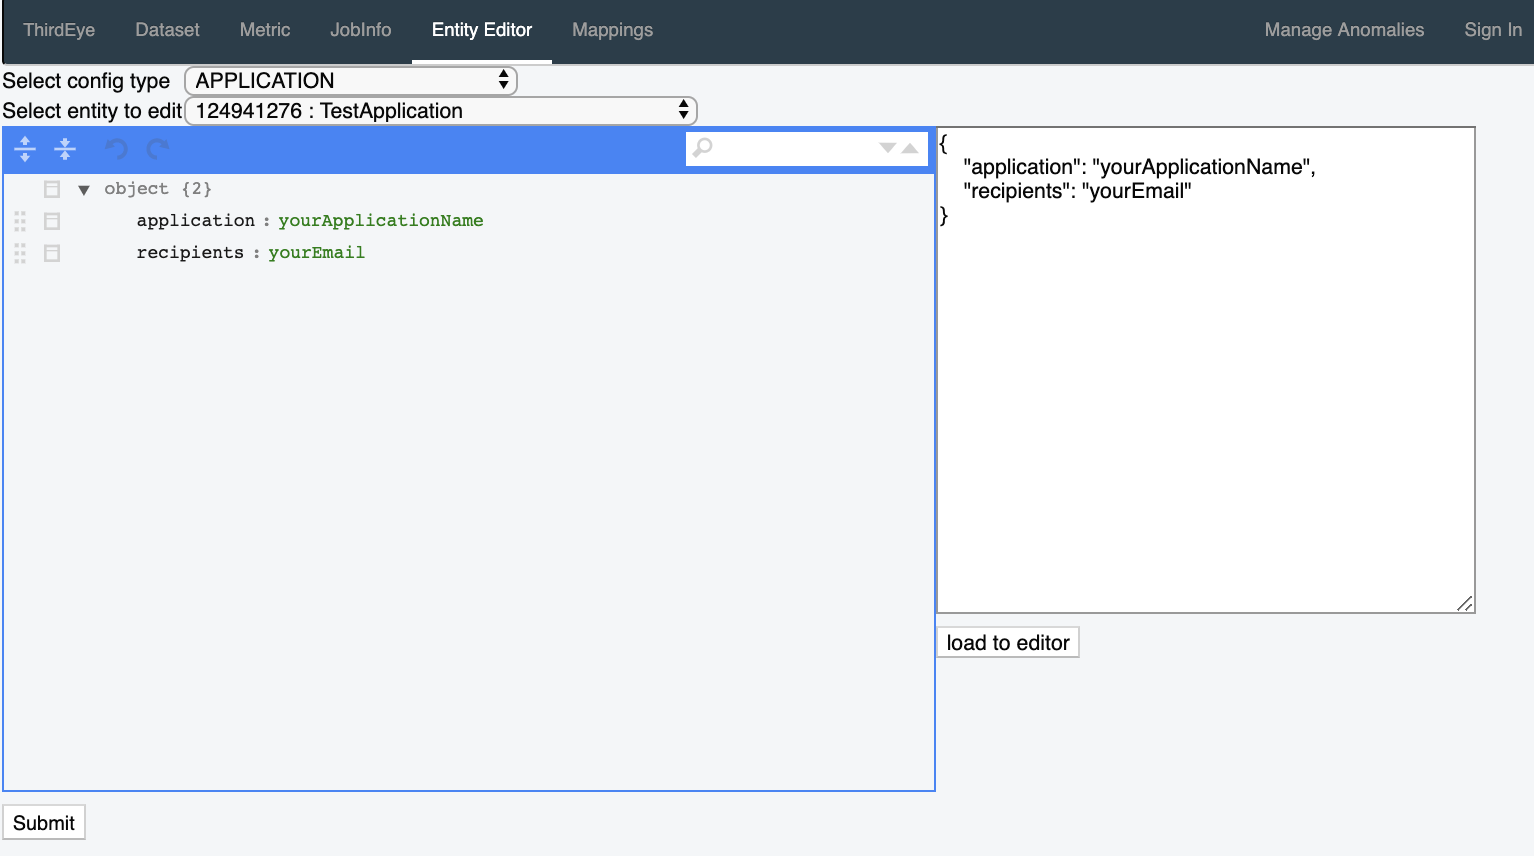
In order to create an application, follow the steps below.
- Go to the
thirdeye-adminpage. http://localhost:1426/thirdeye-admin - Click the
Entity Editortab - Choose
ApplicationfromSelect config type. - In the
Select Entity to Editmenu, selectCreate New - Copy paste the json block below into the textbox on the right and click
load to editor
{
"application": "myApp",
"recipients": "myapp_owner@company.com"
}
- Click
Submiton the bottom left to create an application.
From API
Here are the steps to create an Application from the terminal.
1. Obtain an authentication token. By default, TE auth is disabled, so the credentials are ignored. Feel free to modify the values in the script below.
function tetoken {
curl -s --location --request POST --cookie-jar - 'http://localhost:1426/auth/authenticate' \
--header 'Authorization: Bearer temp' \
--header 'Content-Type: application/json' \
--data-raw '{
"principal": "1",
"password": "1"
}' | grep te_auth | awk '{print $NF}'
}
token=$(tetoken)
- Create the application using the command below. Feel free to update the inline json as per your needs.
function create_te_app {
token=$1
curl --location --request POST 'http://localhost:1426/thirdeye/entity?entityType=APPLICATION' \
--header "Authorization: Bearer ${token}" \
--header 'Content-Type: application/json' \
--header "Cookie: te_auth=${token}" \
--data-raw '{
"application": "MyApp",
"recipients": "myapp_owner@company.com"
}'
}
create_te_app token
Configuration
Overview
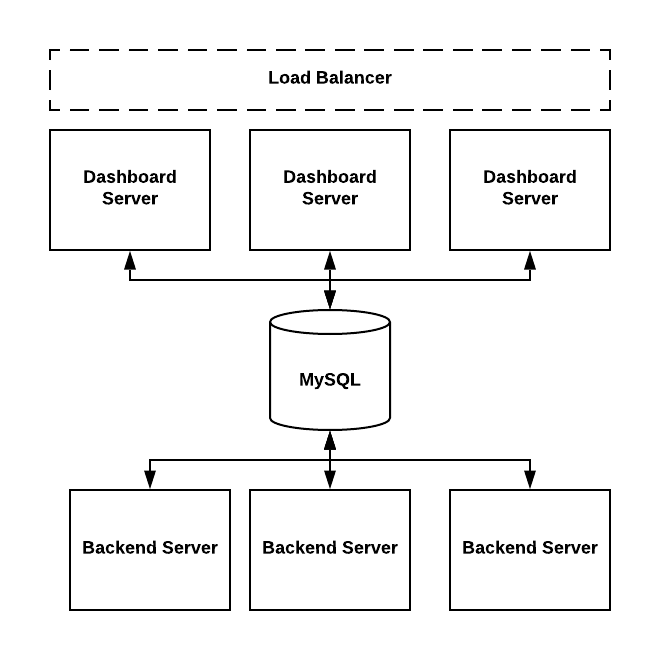
ThirdEye could be deployed on single machine or deployed in clusters.
- Dashboard servers are used to host web applications.
The org.apache.pinot.thirdeye.dashboard.ThirdEyeDashboardApplication class is the entry point.
dashboard.yml and rca.yml are used to configure dashboard servers.
- Backend servers are used to schedule tasks or run the tasks.
The org.apache.pinot.thirdeye.anomaly.ThirdEyeAnomalyApplication class is the entry point.
detector.yml, persistence.yml and data-sources-config.yml are used to configure backend servers.
detector.yml
ThirdEye uses this file to configure the backend server.
You can deploy ThirdEye to multiple nodes with specific modules enabled in each node.
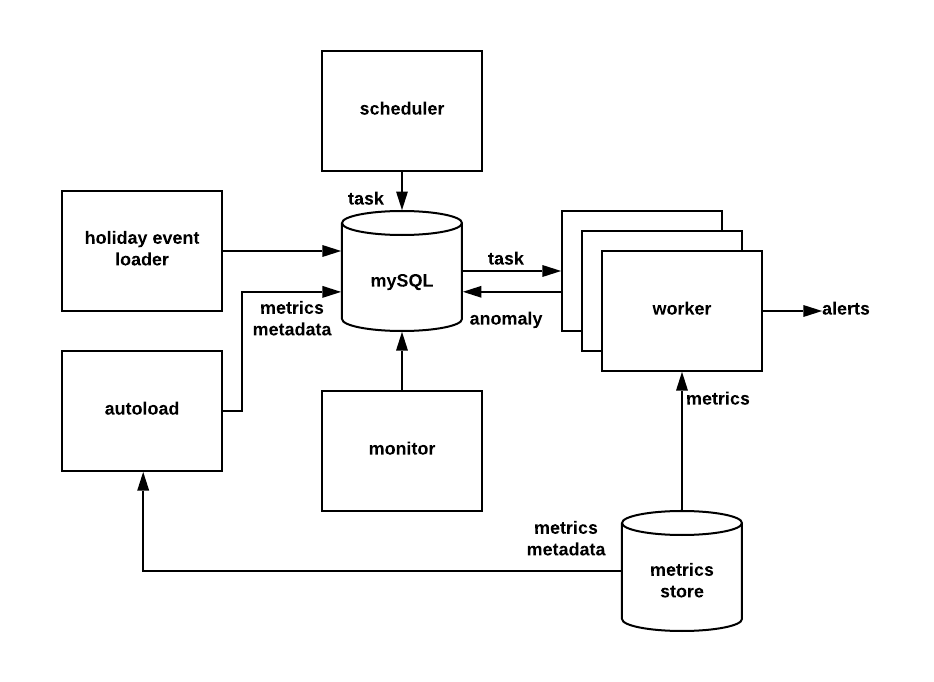
Here are a list of modules you can configure in this file:
- autoload: Load Pinot metrics metadata automatically.
- holidayEventsLoader: Load holiday events from Google Calendar.
- monitor: Used to do clean up tasks. By default ThirdEye will delete - detection tasks that are older than 30 days and alert tasks that are older than 10 days.
- worker: Handles the actual tasks to do anomaly detection or alerting. You can deploy multiple workers to share the load.
- detectionPipeline: Scheduler to generate detection tasks.
- detectionAlert: Scheduler to generate alert tasks.
To enable one module, you can change the module’s value to “true”.
For example, below configures a node with worker and scheduler enabled.
holidayEventsLoader: false
monitor: false
pinotProxy: false
worker: true
detectionPipeline: true
detectionAlert: true
To have the minimum system running you need to enable “worker”, “monitor”, “detectionPipeline” and “detectionAlert”.
Besides the module configuration you can configure the other followings in this file:
- SMTP configuration: Configure SMTP server which is used to send alert mail.
- Log configuration: SLF4J configurations.
- Server ports: Endpoint ports for backend servers.
- Swagger configuration.
- PhantomJSPath: PhantomJS is used to generate anomaly metrics screenshots which are attached in alert mail.
persistence.yml
ThirdEye uses MySQL to store all the metadata. This file is used to configure MySQL database instance.
databaseConfiguration: url: user: password: driver: com.mysql.jdbc.Driver Here is an example:
databaseConfiguration: url: jdbc:mysql:///thirdeye?autoReconnect=true user: te_dev password: xxxxx driver: com.mysql.jdbc.Driver
data-sources-config.yml
ThirdEye doesn’t store the actual metrics but will pull the metrics using data source loaders. This file controls the metrics data sources.
Here is an example used in ThirdEye production which connects to two data sources: PinotThirdEyeDataSource and SqlThirdEyeDataSource.
Please note ThirdEye support MySQL data source, and this configuration is different with persistence.yml.
dataSourceConfigs:
- className: org.apache.pinot.thirdeye.datasource.pinot.PinotThirdEyeDataSource
properties:
zookeeperUrl: '<zookeeperurl>'
clusterName: '<clustername>'
controllerConnectionScheme: 'https'
controllerHost: '<hostname>'
controllerPort: <port>
cacheLoaderClassName: org.apache.pinot.thirdeye.datasource.pinot.PinotD2ResponseCacheLoader
metadataSourceConfigs:
- className: org.apache.pinot.thirdeye.auto.onboard.AutoOnboardPinotMetadataSource
- className: org.apache.pinot.thirdeye.datasource.sql.SqlThirdEyeDataSource
properties:
MySQL:
- db:
te: 'jdbc:mysql://<mysqlurl>/thirdeye?autoReconnect=true'
user: 'thirdeye'
password: '<password>'
For more examples on datasource configurations please check Alert Setup.
cache-config.yml
Decides which caching scheme(s) to use in ThirdEye for optimizing data fetching process. If applicable, contains settings for a user specified cache data source configuration.
useInMemoryCache: true
useCentralizedCache: false
centralizedCacheSettings:
# TTL (time-to-live) for documents in seconds
ttl: 3600
# if inserting data points individually, max number of threads to spawn to parallel insert at a time
maxParallelInserts: 10
# which store to use
cacheDataStoreName: <cache data source of choice>
cacheDataSources:
<cache data source name>:
className: <class name>
config:
<your config setting>: <value>
<your config setting>: <value>
...
<your config setting>: <value>
<cache data source name>:
className: <class name>
config:
<your config setting>: <value>
<your config setting>: <value>
...
<your config setting>: <value>
# you can add more cache data sources below if you like
The configs for cache data sources are flexible and schemaless, so you can add as many config settings as you need or want. For the most part, these settings will probably be used for connection and authentication configuration settings, like host URI(s) or username/password/certificate files to authenticate to the data source.
dashboard.yml
Controls settings relate to web application servers. The followings are configured here:
- LDAP authentication. To enable LDAP authentication, change “authEnabled” to “true”.
authConfig:
authEnabled: true
authKey: <authentication_key>
ldapUrl: <ldap_url>
domainSuffix:
- linkedin.biz
cacheTTL: 3600
cookieTTL: 604800
adminUsers:
- user1
- user2
- Root cause analysis (RCA) configuration: Control thread pool size for RCA pipelines. Default is 5.
- Dashboard host and endpoints configuration.
- Swagger configuration.
rca.yml
This configures the RCA pipelines, which is used to either do metrics analysis or loads events from different systems.
These pipelines are called online and not pre-loaded.
Each pipeline derives from org.apache.pinot.thirdeye.rootcause.Pipeline class, and has “inputNames”, “outputName”, “className” and “properties”. One pipeline can take another pipeline’s output as input and it is a DAG.
The “className” is used to create instances using reflection.
Data Sources Setup
Pinot
0: Prerequisites
Run through the Quick Start guide and shut down the frontend server process.
1: Update the data sources configuration
Insert the connector configuration for Pinot in thirdeye-pinot/config/data-sources/data-sources-config.yml. Your config should look like this:
dataSourceConfigs:
- className: com.linkedin.thirdeye.datasource.pinot.PinotThirdEyeDataSource
properties:
zookeeperUrl: 'myZkCluster.myDomain:12913/pinot-cluster'
clusterName: 'myDemoCluster'
controllerConnectionScheme: 'https'
controllerHost: 'myPinotController.myDomain'
controllerPort: 10611
cacheLoaderClassName: com.linkedin.thirdeye.datasource.pinot.PinotControllerResponseCacheLoader
metadataSourceConfigs:
- className: com.linkedin.thirdeye.auto.onboard.AutoOnboardPinotMetadataSource
- className: com.linkedin.thirdeye.datasource.mock.MockThirdEyeDataSource
...
Note: You’ll have to change the host names and port numbers according to your setup
2: Enable Pinot auto-onboarding
Update the thirdeye-pinot/config/detector.yml file to enable auto onboarding of pinot data sets.
autoload: true
3: Run the backend worker to load all supported Pinot data sets
./run-backend.sh
Note: This process may take some time. The worker process will print log messages for each data set schema being processed. Schemas must contain a timeFieldSpec or a dateTimeFieldSpec in order for ThirdEye to onboard it automatically
4: Stop the backend worker
By pressing Ctrl-C in the terminal
5: Run ThirdEye frontend
./run-frontend.sh
MySQL
This doc will help you understand how to add data sources to ThirdEye. Please run through the Quick Start guide and shut down the frontend server process.
Prerequisites
An accessible MySQL server containing data.
Data sources configuration
Add your MySQL database URL and credentials in thirdeye-pinot/config/datasources/data-sources-config.yml. You will be able to add multiple databases with multiple credentials, as follows:
dataSourceConfigs:
- className: org.apache.pinot.thirdeye.datasource.sql.SqlThirdEyeDataSource
properties:
MySQL:
- db:
<dbname1>: jdbc:mysql://<db url1>
<dbname2>: jdbc:mysql://<db url2>
user: <username>
password: <password>
- db:
<dbname3>: jdbc:mysql://<db url3>
<dbname4>: jdbc:mysql://<db url4>
user: <username2>
password: <password2>
Note: the dbname here is an arbitrary name that you want to name it. In dburl, you still need to include the specific database you are using.
Here’s an example below.
dataSourceConfigs:
- className: org.apache.pinot.thirdeye.datasource.sql.SqlThirdEyeDataSource
properties:
MySQL:
- db:
dataset_pageviews: jdbc:mysql://localhost/dataset
user: uthirdeye
password: pass
Import metric from MySQL
The next step is to import metrics from your dataset into the ThirdEye system. Please see Import metric from Presto/MySQL.
Start an analysis
Point your favorite browser to
http://localhost:1426/app/#/rootcause
and type any data set or metric name (fragment) in the search box. Auto-complete will now list the names of matching metrics. Select any metric to start an investigation.
Presto
0: Prerequisites
Run through the Quick Start guide and shut down the frontend server process.
1: Update the data sources configuration
Add your MySQL database URL and credentials in thirdeye-pinot/config/datasources/data-sources-config.yml. You will be able to add multiple databases with multiple credentials, as follows:
dataSourceConfigs:
- className: org.apache.pinot.thirdeye.datasource.sql.SqlThirdEyeDataSource
properties:
Presto:
- db:
<dbname1>: jdbc:presto://<db url1>
<dbname2>: jdbc:presto://<db url2>
user: <username>
password: <password>
- db:
<dbname3>: jdbc:presto://<db url3>
<dbname4>: jdbc:presto://<db url4>
user: <username2>
password: <password2>
Note: the dbname here is an arbitrary name that you want to name it. In dburl, you still need to include the specific database you are using.
2: Run ThirdEye frontend
./run-frontend.sh
3: Import metric from Presto
See Import metric from Presto/MySQL.
4: Start an analysis
Point your favorite browser to
http://localhost:1426/app/#/rootcause
and type any data set or metric name (fragment) in the search box. Auto-complete will now list the names of matching metrics. Select any metric to start an investigation.
Import metric from Presto/MySQL
0: Prerequisites
Run through step 1-2 in Presto. or MySQL.
1: Import Metric on Front End
Click on this link to import: http://localhost:1426/app/#/self-serve/import-sql-metric
Once the UI is fixed, this link should appear in the create alert page.
Fill in the form which includes the following fields, and click Import Metrics.
Table Name: For Presto, it is the Presto table name, including all schema prefixes. For MySQL it is just the table name.
Time column: Column name that contains the time.
Timezone: Timezone of the time column.
Time Format: Format of the time column.
Time Granularity: The granularity of your metric. For example, daily data should choose 1DAYS.
Hourly data should choose 1HOURS.
Dimensions: Add dimensions and fill in the name of the dimension
Metrics: Add metrics and fill in the name and the aggregation method on the dimension when it is being aggregated by time.
For example:
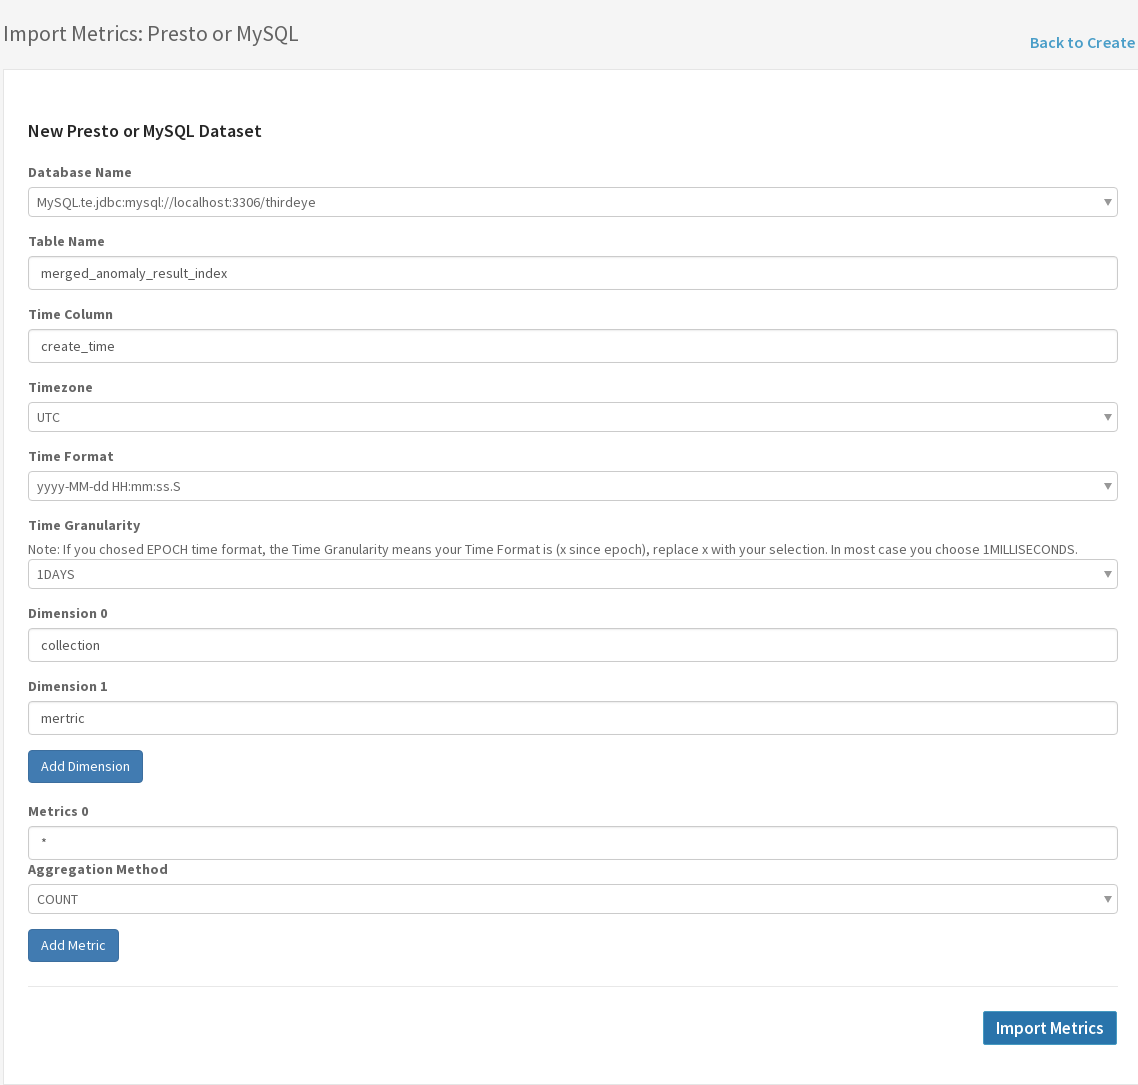
2: Done!
The data set name will be [source name].[db name].[table name]. For example, a ThirdEye monitoring metric data set may be named MySQL.te.merged_anomaly_index_result.
And the metric name is just the metric name you set.
Note that this page does not validate that your entry is correct. Try on the Root Cause Analysis page whether you can see the metric showing up. If not, please retry entering the form again and the previous entry will be overwritten.
Didn’t Find the Data Source You Want? Contribute!
With the interfaces ThirdEye provide, it is not too difficult to add a new data source.
Please refer to SQL and Pinot data source code sql/ and pinot/ under thirdeye-pinot/config/data-sources.
Contributions are highly welcomed. If you have any question, feel free to contact us.
If it is a SQL based data source and can be connected via JDBC
Under thirdeye-pinot/src/main/java/org/apache/pinot/thirdeye/datasource/sql/:
In SqlResponseCacheLoader.java, refer to Presto and MySQL code and add relevent code for the loader.
In SqlUtils.java, you may need to change some SQL queries according to your data source.
That’s it! Then you can add corresponding database config to thirdeye-pinot/config/data-sources/data-sources-config.yml, and see your database showing up
on Import metric from Presto/MySQL page and import it the same way.
If it is not SQL based
One interface is required to be implemented: ThirdEyeDataSource:
For ThirdEyeDataSource, execute is the most important function to implement, which returns a ThirdEyeResponse.
The ThirdEyeResponse can be built using RelationalThirdEyeResponse.
CacheLoader is highly recommended to be used by ThirdEyeDataSource to improve performance. To learn more, please refer to our existing code for Pinot and SQL,
or learn more at CacheLoader (Google Core Libraries for Java).
Again, Please refer to SQL and Pinot data source code sql/ and pinot/ under thirdeye-pinot/config/data-sources.
Caching in ThirdEye
Intro to Caching in ThirdEye
By default, ThirdEye uses an in-memory cache to reduce the number of fetch requests it needs to make to the data source. The in-memory cache is set to use no more than 1/3 of the JVM’s available memory, and can be disabled completely by setting “useInMemoryCache” to be “false” in cache-config.yml. See cache-config.yml. The code for the in-memory cache can be found in:
org.apache.pinot.thirdeye.detection.DefaultDataProvider
ThirdEye also provides optional support for using an external, centralized cache, either as a standalone cache or as an L2 cache. Currently, ThirdEye comes with a connector for using Couchbase as a centralized cache right out of the box. Details for this connector can be found in Couchbase as a Centralized Cache.
If you’d like to use a different data store for your centralized cache instead, see Setting Up Custom Centralized Cache.
Couchbase as a Centralized Cache
Intro
Couchbase is a distributed NoSQL data store. It’s a document store, which means that everything is stored as a “document”, or in JSON-format. An example document looks like this:
{
“key”: “value”,
“key2”: “value2”,
“key3”: [ <arr val1>, <arr val2>, <arr val3>, …]
“key4”: {
“nested key1”: “value”,
“nested key2”: “value2”,
...
}
...
}
Couchbase is “schema-less”, meaning that it doesn’t have a strict schema like traditional SQL. In essence, this means that you can put whatever you want in your document, and you can have multiple types of documents in the same “bucket” (this term will be explained later).
Terminology
- bucket - Think of this as a “database” in a relational SQL database, except there’s no tables. All of your documents go in the bucket. It’s like a container where all your data lives.
- host - a Couchbase node
- N1QL - Couchbase’s SQL-like query language.
- index - a data-structure that provides quick and efficient means to query and access data, that would otherwise require scanning a lot more documents.
Setting up Couchbase as a Cache
ThirdEye comes with the ability to use Couchbase as a centralized cache bundled with it, but there are a few steps to complete before we can get fully connected.
If you already have a Couchbase cluster or have already set up Couchbase Server locally, you can skip ahead to step
Download and setup Couchbase Server locally, or on your server/cluster machines: https://www.couchbase.com/downloads
Go to the Couchbase admin console (for local installations, this will be default to http://localhost:8091).
Create a bucket. The name can be whatever you want. This is where your data will live.
- Create a user (Security -> Add User).
- Note that if you plan to use certificate-based authentication (Couchbase Server Enterprise Edition only), the naming of your user may be important. Ask your local sysadmin if not sure.
Give your user query access on your bucket. Click your user, then click Edit, then under “Roles” find your bucket. Check “Application Access” and all of the boxes under “Query and Index Services”.
Go to the query console (“Query” on the left sidebar) and run the following commands, which will create indexes and make ThirdEye’s queries fast.
CREATE INDEX `timestamp_idx` ON `<your bucket name>`(`timestamp`);
CREATE INDEX `metricId_idx` ON `<your bucket name>`(`metricId`);
Optional:
CREATE INDEX `timestampASC_idx` ON `<your bucket name>`(`timestamp` ASC);
CREATE INDEX `timestampASC2_idx` ON `<your bucket name>`(-`timestamp`);
Theoretically, the last two queries should create the same index (timestamp ordered ascendingly), but results have varied in local testing.
Modify cache-config.yml (found in the data-sources folder) to fit whatever authentication scheme you’re using. The exact meanings of each config setting is explained in the next section.
Enable use of Couchbase by setting the “useCentralizedCache” setting in cache-config.yml to be “true”.
Start up ThirdEye and make sure that ThirdEye can connect correctly. Look for a log message “Caught exception while initializing centralized cache - reverting to default settings”. If you don’t find that message, everything is good, or you forgot to set “useCentralizedCache” to true.
Cache Config Settings Explained
The config file for Couchbase is found in cache-config.yml. These are the settings that ThirdEye comes with by default, but you can add more if you feel like you need them. You may need to add these to the code in the CouchbaseCacheDAO For other settings in cache-config.yml, see cache-config.yml.
Couchbase specific settings:
- useCertificateBasedAuthentication - whether we should authenticate using certificates (Enterprise Edition only). True implies yes, false implies using username/password based authentication instead.
- hosts - list of hosts to connect to. For local setup. this will just be ‘http://localhost:8091’.
- bucketName - name of your bucket, created during setup.
- enableDnsSrv - toggle for whether to use DNS Srv - Couchbase client will just fallback to regular bootstrapping if this fails, so it doesn’t really matter too much.
Username/Password authentication settings – not relevant if using certificate-based authentication
- authUsername - username for username/password based auth, not relevant if using certificate based auth. Set this if you are using username/password based authentication.
- authPassword - same as above but for password
Certificate-based authentication settings – only relevant if you have Couchbase Server Enterprise Edition and want to use certificate-based authentication
- keyStoreFilePath - path to keystore file (identity.p12)
- keyStorePassword - keystore file’s password, if it has one. If not, use ‘work_around_jdk-6879539’ which is how Java handles empty/no passwords for certificates.
- trustStoreFilePath - Path to trust store file - search for something like ‘cacerts’ or talk to your sysadmin.
- trustStorePassword - Password for trust store file, if there is one. If not, empty string or null is fine.
You only need to use one authentication method, either username/password or certificates. Either will work.
Setting Up Custom Centralized Cache
There are a few steps to getting started with your own centralized cache.
Firstly, you will need to setup your data store. This can be locally or on your server cluster, if you have one. Some data stores that we considered before picking Couchbase are Redis, Cassandra, and Memcached.
Then, you will need to add the client for your data source to ThirdEye’s build. For the most part, this can be done by adding the client package’s info to pom.xml for Maven.
Lastly, you will need to make your own DAO class. ThirdEye provides an interface for users who want to use their own data store of choice. This is the CacheDAO interface.
The CacheDAO interface has two methods:
ThirdEyeCacheResponse tryFetchExistingTimeSeries(ThirdEyeCacheRequest request) throws Exception;
void insertTimeSeriesDataPoint(TimeSeriesDataPoint point);
Your DAO will need to implement these methods, and handle connections to your centralized cache. Also keep performance in mind, and you may need to design your own document schema. The schema that ThirdEye uses for Couchbase can be found in the code in the CouchbaseCacheDAO class.
Alert Setup
Basic Alert Setup
Prerequisites
1. Before setting up an alert, you need to make sure you have the data/metrics in ThirdEye.
- Pinot metrics are loaded. See Pinot
- MySQL or Presto metrics are imported. See Import metric from Presto/MySQL.
2. Before running detection (i.e. ./run-backend.sh), you need to have production MySQL database setup, since the demo database does not support simultaneous connections from front end and back end. See production.
Setting up an Alert in ThirdEye
Setting up an alert in ThirdEye is a 2 step process. It involves writing two configuration files on the ThirdEye UI. These configurations empower you to fully control the anomaly detection and unlocks the flexibility to fine tune the platform to meet your needs.
The goal of these two configurations are
- Setting up the detection configuration - for how to detect anomalies.
- Setting up the subscription configuration - for how you want to be subscribed or notified.
We use YAML as the configuration file format. YAML is an indentation-based markup language which aims to be both easy to read and easy to write. You may refer a quick YAML tutorial here.
Step 1: Login to ThirdEye and click on the** Create Alert option
Go to go/thirdeye and login. Click on “Create Alert” tab you see at the right top corner of the page. This should land you on the page where you can now setup the ThirdEye alerts. As we discussed above, there are 2 configurations (detection and subscription) you would need to fill in.
Step 2: Writing the Detection Configuration (Define anomaly detection in YAML)
This configuration defines what kind of rules and detection functions you want to run on the metrics. You may edit and tweak this configuration even after setting up the alerts.
You can take the help of the template in the UI and the below sub-steps to complete this configuration.
If you just want to play around, you may look at an existing sample configuration file here Examples for detection configurations, edit them accordingly and move on to the next step (Step 3).
a. Provide the basic information in the detection configuration
Basic information starts with the name of detection pipeline, description, metric name, dataset name and pipeline type. All these fields are mandatory.
The description of these properties is shown as comments below:
# Give a unique name for this anomaly detection pipeline.
detectionName: name_of_the_detection
# Tell the alert recipients what it means if this alert is fired
description: If this alert fires then it means so-and-so and check so-and-so for irregularities
# The metric you want to do anomaly detection on.
metric: metric_name
# The data set name for the metric.
dataset: dataset_name
The metric and dataset could be auto-completed (Ctrl + Space) by yaml editor. For metrics from UMP/Pinot, the dataset name is the actual Pinot table name. It has the naming convention of <ump_dataset_name>**_additive** or <ump_dataset_name>**_non_additive**, depends on whether the metric is additive or not. For metrics from inGraph the dataset name is the inGraph dashboard name.
b. Start adding detection rules
Detection rules tell ThirdEye what kind of algorithms or rules it needs to run to detect anomalies. ThirdEye supports multiple rules combined together with “OR” relationship.
For example, the config below defines a rule saying I would like to generate anomalies if the week over week change of this metric is more than 10%.
- detection:
- name: detection_rule_1 # Unique name for this detection rule
type: PERCENTAGE_RULE # The type for this detection rule or filter rule. See all supported detection rules and filter rules below.
params: # The parameters for this rule. Different rules have different params.
offset: wo1w
percentageChange: 0.1
To see the complete list of detection rules, click here :ref:`all-detection-rules.
To explore more advanced detection configuration settings, click here :ref:`advanced-detection
c. A Complete detection configuration example with basic settings
To see more examples, click here. :ref:`templates-detection.
# Provide a unique detection name
detectionName: thirdEyeTeam_thirdeyeWebapp_pinotExceptionCounter_UP
# Update the description
description: If this alert fires then it means that we see are seeing
lot of pinot call exceptions. Please check the controller logs to
investigate.
# Update and choose a different metric (Ctrl + Space to look ahead)
metric: thirdeye_controller_pinotExceptionCounter
dataset: thirdeye-all
# Configure multiple rules. ThirdEye supports single or a list of rules combined together with "OR" relationship
rules:
- detection: # Eg. Detect anomalies if the week over week change of this metric is more than 10%
- name: detection_rule_1 # Give a unique name for this detection rule.
type: PERCENTAGE_RULE
params:
offset: wo1w # Compares current value with last week. (Values supported - wo1w, wo2w, median3w etc)
percentageChange: 0.1 # The threshold above which you want to be alerted.
pattern: UP # Alert when value goes up or down by the configured threshold. (Values supported - UP, DOWN, UP_OR_DOWN)
Step 3: (Beta) Preview the alert configurations
Click the preview drop down and then click the preview button.
ThirdEye will run anomaly detection for the period of last week using your configuration and show you the anomalies result in the UI. If you think the result is good you can go ahead to the next step. Otherwise, you can go back and edit the detection YAML configuration and preview again.
Step 4: Writing the Subscription-Group Configuration (Define notification settings)
This configuration defines who and how you want to be notified of the anomalies. This configuration can be edited later as per your needs.
If you want to add the above detection rule to an existing subscription group then,
- Select your subscription group from the drop down which says “Add this alert to an existing subscription group”
- Specify the detectionName you defined above under the subscribedDetections field in your subscription config.
Otherwise, skip this leaving “Create a subscription group” in the drop down. Take the help of the template in the UI and the below sub-steps to complete this configuration.
If you just want to play around, you may look at an existing sample configuration file here Examples for subscription group configurations. edit them accordingly and move on to the next step (Step 5).
a. Provide the basic information
Basic information starts with the name of subscription group, the registered application name and the subscription type. All these fields are mandatory.
You can find the description of the properties in-line below:
# The name of the subscription group. You may choose an existing or a new subscription group name
subscriptionGroupName: name_of_the_subscription_group
# Every alert in ThirdEye is attached to an application. Please specify the registered application name here.
# You may request for a new application by dropping an email to ask_thirdeye
application: name_of_the_registered_application
# The default subscription type. See note below for exploring other subscription types like dimension alerter.
type: DEFAULT_ALERTER_PIPELINE
To see the complete list of subscription types, click here :ref:`all-subscription.
b. Tell us which rules you want to subscribe to
A subscription group in ThirdEye can subscribe to one or more detection rules. Here you need to list the unique names of all such detection functions. When you are creating a new alert, just copy over the detectionName from the detection yaml which you have configured above and paste it here.
# List of detection names that you want to subscribe.
subscribedDetections:
- name_of_the_detection # This is the unique name (detectionName) you defined in the detection config.
- another_detection_name # Include more rules under the same subscription group
c. Tell us how soon you want to be alerted and the recipients
Alert Frequency / Cron:
Alert Frequency or cron is a way of defining when you want to get the notification/alert for the anomaly. In most cases users want to be notified immediately after the anomaly is detected for which we recommend the below value. There are others who wish to be notified at the end of the day, every hour etc. You may use an online cronmaker if you wish to set up your own custom frequency. By default, the cron in the config below will notify you immediately after an anomaly is detected.
Alert Scheme:
Now let’s define the alert scheme and the recipients of the alerts. Alerting schemes (Email, Iris) define how a user/group should be alerted. We recommend using the default Email based alerting for your alerts. However, if you wish to setup Iris alerts to leverage the power of escalation paths refer to the advanced settings section below.
# The frequency at which you want to be notified. Typically you want to be notified immediately
# when an anomaly is found. The below cron runs every 5 minutes.
cron: "0 0/5 * 1/1 * ? *"
# Configuring how you want to be alerted. You can receive the standard ThirdEye email alert (recommended)
# or use Iris alerting to leverage the power of escalation paths. For details refer additional settings below.
alertSchemes:
- type: EMAIL
# Sender of the alert. Please avoid changing this field. fromAddress: thirdeye-dev@linkedin.com
# Configure the recipients for the email alert. We recommend putting thirdeye-dev in the cc field.
recipients:
to:
- "ldap-user@linkedin.com"
- "ldap-group@thirdeye.com"
cc:
- "thirdeye-dev@thirdeye.com"
bcc:
- "user-bcc@linkedin.com"
In theory, users can also subscribe to multiple alerting schemes. For example, users can subscribe to either the existing thirdeye email alerts (recommended) or Iris alerts or both.
e. Explore more advanced subscription group settings
Click here :ref:`advanced-subscription to explore the advanced settings.
f. A Complete notification configuration example with basic settings
Below is the most common example of a Third Eye notification configuration. To see more examples, click here. :ref:`templates-subscription
# Provide a unique name to your subscription group or pick your existing subscription group from the drop-down above.
subscriptionGroupName: thirdeye_monitoring_group
# Every alert in ThirdEye is attached to an application. Please specify the registered application name here. Use [sandbox] only for testing.
application: [sandbox]
type: DEFAULT_ALERTER_PIPELINE
cron: "0 0/5 * 1/1 * ? *"
subscribedDetections:
- thirdEyeTeam_thirdeyeWebapp_pinotExceptionCounter_UP # Mention the detectionName you defined in the detection configuration above
alertSchemes:
- type: EMAIL
fromAddress: thirdeye-dev@linkedin.com
recipients:
to:
- "user@linkedin.com" # Update the recipients
- "group@linkedin.com"
cc:
- "thirdeye-dev@linkedin.com"
referenceLinks: # Update reference links
- "Oncall Runbook": "http://go/oncall"
- "Thirdeye FAQs": "http://go/thirdeyefaqs"
Step 5: Click on Create Alert to submit the alert configurations
This is the last step of alert creation. After completing both the configurations, click on the Create Alert button at the bottom of the page.
Behind the scenes, we tune and replay the detection for the last 1 month and generate historical anomalies. This will happen in the background and you will be notified in a couple of minutes via an email about the status of this alert. You can then view the alert along with the historical anomalies to see how well your detection performed. You can also choose to edit the detection and notification configurations and tweak them further to suit to your needs.
See Advanced Detection configurations for more details.
Advanced Detection configurations
Multiple detection rules
Multiple detection rules can be easily set up on the same metric.
For example:
In the following example, multiple detection rules is set up on the page_view metric. First, there is a percentage change rule. If the week-over-week change is more than 10 percent, detect it as an anomaly. Second, a threshold rule is set up, if the metric is less than 35800000, detect it as an anomaly. Third, algorithm detector is set up to detect anomalies automatically, also out of the anomalies detected by the algorithms, an anomaly filter is set up to say it’s an anomaly only if it compared to median over 4 weeks value, the change is more than 1%.
detectionName: test_yaml
description: If this alert fires then it means so-and-so and check so-and-so for irregularities
metric: page_view
dataset: business_intraday_metrics_dim_rt_hourly_additive
rules:
- detection: # Eg. Detect anomalies if the week over week change of this metric is more than 10%
- name: detection_rule_1 # Give a unique name for this detection rule.
type: PERCENTAGE_RULE # Configure the detection type here. See doc for more details.
params: # The parameters for this rule. Different rules have different params.
offset: wo1w # Compare current value with last week. (Values supported - wo1w, wo2w, median3w etc)
percentageChange: 0.10 # The threshold above which you want to be alerted.
pattern: UP_OR_DOWN # Alert when value goes up or down by the configured threshold. (Values supported - UP, DOWN, UP_OR_DOWN)
- detection:
- name: detection_rule_2
type: THRESHOLD
params:
min: 35800000
- name: filter_rule_2
type: PERCENTAGE_CHANGE_FILTER
params:
offset: median4w
threshold: 0.01
Anomaly filter rules
Each detection rule can be followed by multiple filter rules. The anomalies generated by detection rule must pass all the filter rules attached to it to be saved & sent.
For example:
- detection:
- name: detection_rule_1 # Unique name for this detection rule
type: THRESHOLD # The type for this detection rule or filter rule.
params: # The parameters for this rule. Different rules have different params.
min: 10000
filter:
- name: filter_rule_1
type: PERCENTAGE_CHANGE_FILTER
params:
offset: wo1w
threshold: 0.01
- name: filter_rule_2
type: PERCENTAGE_CHANGE_FILTER
params:
offset: median4w
threshold: 0.01
This yaml will generate anomalies when the metric value is above 10000 and when compared to the week over week value, the change is above 1% and when compared to the median over 4 weeks value, the change is above 1%.
Anomaly filters are powerful tools to customize the anomaly detection.
To see the complete list of supported detection filter rules, click here :ref: `all-filter-rules.
Detection cron schedule
The cron schedule defines how often the detection runs and at what time it runs.
If the cron is not specified in the configuration, then ThirdEye will pick a default schedule. The default schedule depends on the data granularity. For daily metric, the cron is “0 0 14 * * ? *” which runs the detection at 14:00:00 pm UTC every day. For hourly metric, the detection is run at the beginning of every hour. For minute-level metric, the detection is run at every 15 minutes. (i.e. at minute :00, :15, :30, :45 of every hour.)
This can be configured to fit the data point generation time to reduce the time to detect the anomaly. For example, ” 0 0 0 * * ? * ” means do detection at 00:00:00 am UTC every day.
In the YAML this is configured at the level of a pipeline. Here is a good quartz cron schedule generator: https://www.freeformatter.com/cron-expression-generator-quartz.html
| parameter name | supported values |
|---|---|
| cron | valid cron schedule |
YAML format:
cron: 0 0 14 * * ? * # Run daily at 2 PM UTC (7 AM PDT)
Deactivate the detection
Turn on/off the detection. If this parameter is missing, the detection will be turned on by default.
| parameter name | supported values |
|---|---|
| active | true/false |
YAML format:
active: false
Dimension exploration
ThirdEye supports creating alerts for each dimension value in a dimension. For example, you can set an alerts for all the values in countries, etc.
YAML format:
dimensionExploration:
dimensions:
- dimension_name_1 # name of the dimension
Explore dimension combinations is also supported. For example, if an alert is set for all combinations of platforms and countries, that means for each platform-country combination, there will be an detection set up. i.e. detection for ios-us, ios-uk, ios-fr, andorid-us, andorid-uk, android-fr, etc.
To help for finding the right dimensions, auto-complete is turned on for dimension values in ThirdEye YAML editor.
YAML format:
dimensionExploration:
dimensions: # a list of dimensions
- dimension_name_1
- dimension_name_2
Dimension filter
ThirdEye supports creating alerts for a filtered metric. For example, monitor the page views only in US. Multiple dimension filters is also supported.
The dimension name and dimension values have to be string. If the dimension name or value is double, interger, boolean value, etc, it need to be wrapped by double quotes.
YAML format:
filters:
dimension_name: # a list of dimensions
- dimension_value_1
- dimension_value_2
For example:
# monitor this metric where ip\_country\_code=us and browser in safari,
chrome, firefox.
# monitor this metric where ip_country_code=us and browser in safari, chrome, firefox.
filters:
ip_country_code:
- us
browser:
- safari
- chrome
- firefox
Data filter
ThirdEye supports filter on input data before running detection algorithm. E.g, You may not want to detect changes from 0.01 to 0.02, which is noisy although it is 100% change. It’s set under “dimensionExploration” section.
You don’t need to have dimension in order to set up data filter. E.g, you can set up data filter on inGraph data which doesn’t have dimension, but you need to set it under “dimensionExploration” section.
| parameter name | description | supported values |
|---|---|---|
| minContribution | only monitor the dimension combinations contributes to overall metric is larger than the contribution | double value between 0 to 1 |
| k | only monitor the dimension combinations contributes to overall metric is in top k. | integer |
| minValue | the aggregate value of this dimension combination must be larger than the threshold. If ‘dimensions’ field not set, this will apply to the overall metric. | double |
| minValueHourly | the aggregate value of this dimension combination hourly must be larger than the threshold. If ‘dimensions’ field not set, this will apply to the overall metric. | double |
| minValueDaily | the aggregate value of this dimension combination daily must be larger than the threshold. If ‘dimensions’ field not set, this will apply to the overall metric. | double |
| dimensionFilterMetric | The metric for dimension explore, dimension filter and data filter. If this value is not set, the metric used in dimension filter will be the same metric as the main metric. This can be different from a metric that the detection runs on(aka the main metric), but the dimension filter metric have to be in the same data set of the main metric. | String. Metric name in the same dataset as the main metric. |
YAML format:
dimensionExploration:
dimensions: # optional, only needed when your metric has dimension
# a list of dimensions
- dimension_name_1
- dimension_name_2
minContribution: 0.05 # only monitor the dimension combinations contributes to overall metric is larger than 5%
k: 10 # only monitor the dimension combinations contributes to overall metric is in top 10
minValue: 10
minValueHourly: 20
minValueDaily: 100
dimensionFilterMetric: cold_signup # The metric for dimension explore, dimension filter and data filter. Can be a different metric.
Anomaly Merging
ThirdEye will merge anomalies for the same metric & dimension if they are overlapped with each other. The merger’s behavior is configurable from yaml.
| parameter name | description | supported values | default value |
|---|---|---|---|
| maxGap | The gap in milliseconds between two anomalies in order to be merged. If the gap between two anomalies is less than this value, they will be merged into one anomaly. | long | 7200000 (2 Hours) |
| maxDuration | the maximum allowed duration of a merged anomaly. | long (Must be >= 900000 (15 mins)) | MAX_VALUE |
For example:
merger:
maxGap: 3600000 # set the gap of merging to be 1 hour.
maxDuration: 86400000 # set the longest anomaly allowed to be one day
Advanced Subscription Group configurations
Enable/Disable Notification
Disabling an alert notification will disable all and any kind of alerting scheme that you may have configured. You will completely stop receiving notifications.
# Enable or disable notification of alert
active: true
Note: As long as the detection is not disabled, we will continue to detect anomalies and display them on the ThirdEye UI but you will not be notified.
Modify Alert Email Subject
Different teams use Third Eye for monitoring different scenarios. For some who monitor a dataset, they prefer to have the dataset name in the alert email title, others who monitor metrics would like to have the metric or the subscription group name in the alert title. By default, we include the metric name in the alert email title. If you wish to configure it differently, then include the below line in your subscription config.
emailSubjectStyle: ALERTS # Allowed values - [ALERTS, METRICS, DATASETS]
| Parameter | Description | Alert Email Subject Template | Example: Alert Email Subject |
|---|---|---|---|
| ALERTS | Only uses the subscription group name in the alert email subject | Thirdeye Alert : my_subscription_group_name | Thirdeye Alert : m2g_alert_monitoring |
| METRICS | Includes the name of the metrics which had an anomaly in the email subject. | Thirdeye Alert : my_subscription_group_name - <comma-separated-list-of-metrics> | Thirdeye Alert : m2g_alert_monitoring - cold_signup |
| DATASETS | Includes the dataset names of the metrics which had an anomaly in the alert email subject. | Thirdeye Alert : my_subscription_group_name - <comma-separated-list-of-datasets> | Thirdeye Alert : m2g_alert_monitoring - business_intraday_metrics_dim_rt_hourly_additive |
Enable/Disable Alert Suppression
Alerts can be suppressed to avoid generating too many alert notifications especially during maintenance windows, deployments, or unexpected variations in metric during holidays like Thanksgiving, Christmas, or during the beginning/end of quarter when metric usually spikes, etc.
Completely suppress alert for a period
As the title says, if you use the below configs in the subscription config, you will not receive any alerts for the configured duration.
alertSuppressors:
- type: TIME_WINDOW # Suppresses all anomalies/alerts which START after windowStartTime and before windowEndTime
params:
windowStartTime: 1542888000000 # The suppression window start time in epoch millis.
windowEndTime: 1543215600000 # The suppression window end time in epoch millis.
Partially suppress alert for a period after applying some thresholds
If you do not want to completely suppress an alert and also not prefer receiving a lot of alerts especially during long shutdown periods like Christmas, then you can opt to receive only the most severe alerts. To configure this, you would need to let Third Eye know a reasonable window based on some thresholds within which anomalies can be ignored.
alertSuppressors:
- type: TIME_WINDOW
params:
windowStartTime: 1542888000000
windowEndTime: 1543215600000
isThresholdApplied: true
expectedChange: -0.25 # Expect the metric to drop by 25 percent during the configured time window
acceptableDeviation: 0.10 # Any variation of 10 percent up/down after the drop is reasonable and anomalies detected within this window can be ignored.
Note: Suppression only suppresses the notification of the anomaly. Third Eye will continue to run anomaly detection even during the suppression window, detect anomalies and automatically label them as True Positive.
Templates and examples
For step-by-step instructions and additional details on these config files refer above sections.
Examples for detection configurations
Example of a simple Threshold Rule (Min-Max)
Fire an alert when the metric cross some static thresholds. For more details about this rule see 2. Threshold Rule (type: THRESHOLD).
detectionName: lite_liteFrontend_pageLoadTime90percentile_UP
description: If this alert fires then it means that the 90 percentile page load time for p_mwlite_feed_updates has exceeded the 7 second threshold set in India. Please check the run-book to investigate.
metric: page_load_time_90percentile
dataset: sitespeed_thirdeye
filters:
country:
- IN
page_name:
- p_mwlite_feed_updates
rules:
- detection:
- name: detection_rule1
type: THRESHOLD
params:
max: 7000
Example of a Percentage based rule
Fire an alert when the percentage change is above a certain static threshold when comparing the current time-series with the baseline (Week over X weeks, Median of X weeks, etc.). For more details about this rule see 1. Percentage Rule (type: PERCENTAGE_RULE).
detectionName: test_yaml_1
description: If this alert fires then it means so-and-so and check so-and-so for irregularities
metric: page_view
dataset: business_intraday_metrics_dim_rt_hourly_additive
dimensionExploration:
dimensions:
- browserName
rules:
- detection:
- name: detection_rule_1
type: PERCENTAGE_RULE
params:
offset: wo1w
percentageChange: 0.01
Example of multiple rules:
detectionName: test_yaml
description: If this alert fires then it means so-and-so and check so-and-so for irregularities
metric: page_view
dataset: business_intraday_metrics_dim_rt_hourly_additive
cron: 0 0 0/1 ? * * *
rules:
- detection:
- name: detection_rule_1
type: PERCENTAGE_RULE
params:
offset: wo1w
percentageChange: 0.01
- detection:
- name: detection_rule_2
type: THRESHOLD
params:
min: 38000000
filter:
- name: filter_rule_1
type: PERCENTAGE_CHANGE_FILTER
params:
offset: median4w
threshold: 0.01
- detection:
- name: detection_rule_3
type: HOLT_WINTERS_RULE
params:
sensitivity: 5
Examples for subscription group configurations
Example of a simple subscription group
subscriptionGroupName: name_of_the_subscription_group
application: name_of_the_registered_application
type: DEFAULT_ALERTER_PIPELINE
cron: "0 0/5 * 1/1 * ? *"
subscribedDetections:
- name_of_the_detection
alertSchemes:
- type: EMAIL
fromAddress: thirdeye-dev@linkedin.com
recipients:
to:
- "user@linkedin.com"
- "group@linkedin.com"
cc:
- "thirdeye-dev@linkedin.com"
bcc:
- "user@linkedin.com"
referenceLinks:
"Oncall Runbook": "http://go/oncall"
"Thirdeye FAQs": "http://go/thirdeyefaqs"
Example of a Dimensional Alerting subscription group
subscriptionGroupName: name_of_the_subscription_group
application: name_of_the_registered_application
type: DIMENSION_ALERTER_PIPELINE
dimension: app_name
dimensionRecipients:
"android":
- "android-oncall@linkedin.com"
"ios":
- "ios-oncall@linkedin.com"
cron: "0 0/5 * 1/1 * ? *"
subscribedDetections:
- name_of_the_detection
alertSchemes:
- type: EMAIL
fromAddress: thirdeye-dev@linkedin.com
recipients:
to:
- "user@linkedin.com"
- "group@linkedin.com"
cc:
- "thirdeye-dev@linkedin.com"
bcc:
- "user@linkedin.com"
referenceLinks:
"Oncall Runbook": "http://go/oncall"
"Thirdeye FAQs": "http://go/thirdeyefaqs"
Appendix
A. List of all supported detection rules:
1. Percentage Rule (type: PERCENTAGE_RULE)
Compares current time series to a baseline, if the percentage change is above a certain threshold, detect it as an anomaly.
Example:
rules:
- detection:
- name: detection_rule_1
type: PERCENTAGE_RULE
params:
offset: wo1w
percentageChange: 0.1
pattern: UP_OR_DOWN
Parameters:
| param | description | default value | supported values |
|---|---|---|---|
| offset | the baseline time series to compare with. | wo1w | * hoXh hour-over-hour data points with a lag of X hours * doXd day-over-day data points with a lag of X days * woXw week-over-week data points with a lag of X weeks * moXm month-over-month data points with a lag of X months * meanXU average of data points from the the past X units (hour, day, month, week), with a lag of 1 unit) * medianXU median of data points from the the past X units (hour, day, month, week), with a lag of 1 unit) * minXU minimum of data points from the the past X units (hour, day, month, week), with a lag of 1 unit) * maxXU maximum of data points from the the past X units (hour, day, month, week), with a lag of 1 unit) |
| percentageChange | The percentage threshold. If the percentage change is above this threshold, detect it as an anomaly. | NaN | double values NaN means no threshold set. |
| pattern | Detect as an anomaly if the metric drop, rise or both directions. | UP_OR_DOWN | UP: detect as an anomaly only if the current time series is above the baseline. DOWN: detect as an anomaly only if the current time series is below the baseline. UP_OR_DOWN: detect as an anomaly in both directions |
2. Threshold Rule (type: THRESHOLD)
If metric is above the max threshold or below the min threshold, detect is as an anomaly.
Example:
rules:
- detection:
- name: detection_rule_1
type: THRESHOLD
params:
max: 1000
min: NaN
Parameters:
| params | description | default value | supported values |
|---|---|---|---|
| max | If the metric goes above this value, detect is as an anomaly. | NaN | double values NaN means no threshold set. |
| min | If the metric goes above below value, detect is as an anomaly. | NaN | double values NaN means no threshold set. |
3. Holt-Winters Algorithm (type: HOLT_WINTERS_RULE)
Holt-Winters Algorithm is a commonly used statistic forecasting algorithm for anomaly detection.
This algorithm performs very well for daily data and monthly data.
For hourly data and minutely data, please trial and error more patiently with duration filters and percentage filters.
Minimal configuration (for any granularity):
rules:
- detection:
- name: detection_rule_1
type: HOLT_WINTERS_RULE
params:
sensitivity: 6 # Detection sensitivity scale from 0 - 10, mapping z-score from 1 to 3.
pattern: UP_OR_DOWN # Alert when value goes up or down by the configured threshold. (Values supported - UP, DOWN, UP_OR_DOWN)
Optional Parameters:
| param | description | default value | supported values |
|---|---|---|---|
| sensitivity | Detection sensitivity scale from 0 - 10, mapping z-score from 1 to 3. | 5 | any double in [0, 10] |
| pattern | Detect as an anomaly if the metric drop, rise or both directions. | UP_OR_DOWN | UP, DOWN, UP_OR_DOWN |
| alpha | level smoothing factor | Optimized by BOBYQA optimizer to minimize error | any double in [0, 1] |
| beta | trend smoothing factor | Optimized by BOBYQA optimizer to minimize error | any double in [0, 1] |
| gamma | seasonal smoothing factor | Optimized by BOBYQA optimizer to minimize error | any double in [0, 1] |
| period | seasonality period, default 7 for daily, hourly and minutely data. For monthly data, set it to 12. For non-seasonal data, set it to 1. | 7 | Any positive interger |
| smoothing | For smoothing of hourly and minutely data to reduce noise | true | true or false |
4. Absolute change Rule (Type: ABSOLUTE_CHANGE_RULE)
Compares current time series to a baseline, if the absolute change is above a certain threshold, detect it as an anomaly.
Example:
rules:
- detection:
- name: detection_rule_1
type: ABSOLUTE_CHANGE_RULE
params:
offset: wo1w
absoluteChange: 100
pattern: UP_OR_DOWN
Parameters:
| param | description | default value | supported values |
|---|---|---|---|
| offset | the baseline time series to compare with. | wo1w | * hoXh hour-over-hour data points with a lag of X hours * doXd day-over-day data points with a lag of X days * woXw week-over-week data points with a lag of X weeks * moXm month-over-month data points with a lag of X months * meanXU average of data points from the the past X units (hour, day, month, week), with a lag of 1 unit) * medianXU median of data points from the the past X units (hour, day, month, week), with a lag of 1 unit) * minXU minimum of data points from the the past X units (hour, day, month, week), with a lag of 1 unit) * maxXU maximum of data points from the the past X units (hour, day, month, week), with a lag of 1 unit) |
| absoluteChange | The absolute change threshold. If the absolute change when compared to the baseline is above this threshold, detect it as an anomaly. | NaN | double values NaN means no threshold set. |
| pattern | Detect as an anomaly if the metric drop, rise or both directions. | UP_OR_DOWN | UP: detect as an anomaly only if the current time series is above the baseline. DOWN: detect as an anomaly only if the current time series is below the baseline. UP_OR_DOWN: detect as an anomaly in both directions |
B. List of all supported filter rules
.._filter-percentage:
1. Percentage change anomaly filter (type: PERCENTAGE_CHANGE_FILTER)
Filter the anomaly if compared to the baseline, percentage change is below a certain threshold.
Example:
filter:
- name: filter_rule_1
type: PERCENTAGE_CHANGE_FILTER
params:
threshold: 0.1 # filter out all changes less than 10%
Parameters:
| params | description | default value | supported values |
|---|---|---|---|
| threshold | The percentage threshold. If the percentage change is below this threshold, filter the anomaly. | NaN | double values NaN means no threshold set. |
| offset | The baseline timeseries used to calculate the baseline value. | The default baseline used in detection algorithm. | * hoXh hour-over-hour data points with a lag of X hours
* doXd day-over-day data points with a lag of X days
* woXw week-over-week data points with a lag of X weeks
* moXm month-over-month data points with a lag of X months
* meanXU average of data points from the the past X units (hour, day, month, week), with a lag of 1 unit)
* medianXU median of data points from the the past X units (hour, day, month, week), with a lag of 1 unit)
* minXU minimum of data points from the the past X units (hour, day, month, week), with a lag of 1 unit)
* maxXU maximum of data points from the the past X units (hour, day, month, week), with a lag of 1 unit)
If this value is not set, it will use the default baseline. E.g, if the detection uses PERCENTAGE_RULE and offset is wo1w then the baseline is last week’s value. If the detection type is ALGORITHM then the baseline is generated by algorithm. |
| pattern | Keep as an anomaly if the metric drop, rise or both directions. | UP_OR_DOWN | UP: Keep the anomaly only if the current value is above the baseline and passes the threshold. DOWN: Keep the anomaly only if the current value is below the baseline and passes the threshold. UP_OR_DOWN: Keep the anomaly if it passes the threshold regardless of metric moving to which directions |
.._filter-sitewide:
2. Site wide impact anomaly filter (Type: SITEWIDE_IMPACT_FILTER)
Filter the anomaly if its site wide impact is below a certain threshold.
How site wide impact is calculated?
SWI = (currentValue of the anomaly - baselineValue of the anomaly) / (current value of the site wide metric in the anomaly range)
Example:
In the following example, we are setting up an anomaly detection pipeline for all the possible platforms (such as ios, android, windows, etc) in the US. We use the percentage rule to detect the anomaly, if the metric compared to median over 4 weeks value is up or down 1%, and the site-wide impact for the anomaly is larger than 1%, we say this is an anomaly.
For example, an anomaly is detected in iOS platform , the anomaly happens 2pm to 3pm. The site wide impact is calculated by: Taking the the total number of sign ups on iOS in U.S. between 2 to 3 pm, minus the week over week baseline value between 2 to 3 pm and then divided the current signup value of U.S. among all platforms.
detectionName: swi_monitor
metric: signups
dataset: registration_metrics_v2_additive
dimensionExploration:
dimensions:
platform
filters:
country:
us
rules:
- detection:
- name: detection_rule1
type: PERCENTAGE_RULE
params:
offset: median4w
percentageChange: 0.01
filter:
- type: SITEWIDE_IMPACT_FILTER
name: filter_rule_1
params:
threshold: 0.01
pattern: up_or_down
offset: wo1w
sitewideMetricName: signups
sitewideCollection: registration_metrics_v2_additive
filters:
country:
us
Parameters:
| params | description | default value | supported values & descriptions |
|---|---|---|---|
| threshold | The percentage threshold. If the percentage change is below this threshold, filter the anomaly. | NaN | double values NaN means no threshold set. |
| pattern | Keep as an anomaly if the metric drop, rise or both directions. | UP_OR_DOWN | UP: Keep the anomaly only if the current value is above the baseline and passes the threshold. DOWN: Keep the anomaly only if the current value is below the baseline and passes the threshold. UP_OR_DOWN: Keep the anomaly if it passes the threshold regardless of metric moving to which directions |
| sitewideMetricName | The metric to calculate the site wide baseline value | By default, use the same metric as the anomaly without the dimension filters. | All metric names in ThirdEye. |
| sitewideCollection | The metric to calculate the site wide baseline value | By default, use the same metric as the anomaly without the dimension filters. | The dataset name for the site wide metric. The sitewideCollection must be configured together with the sitewideMetricName. |
| filters | The dimension filter for the site wide metric | By default, use the same metric as the anomaly without the dimension filters. | See Dimension filter to configure the filters for site wide metric. This filters must be configured together with the sitewideMetricName. |
| offset | The baseline time series used to calculate the baseline value. | Use the baseline value generated in detection for the anomaly. | * hoXh hour-over-hour data points with a lag of X hours * doXd day-over-day data points with a lag of X days * woXw week-over-week data points with a lag of X weeks * moXm month-over-month data points with a lag of X months * meanXU average of data points from the the past X units (hour, day, month, week), with a lag of 1 unit) * medianXU median of data points from the the past X units (hour, day, month, week), with a lag of 1 unit) * minXU minimum of data points from the the past X units (hour, day, month, week), with a lag of 1 unit) * maxXU maximum of data points from the the past X units (hour, day, month, week), with a lag of 1 unit) |
3. Threshold-based anomaly filter (Type: THRESHOLD_RULE_FILTER)
Filter the anomaly if the metric current value in the anomaly time duration is outside of the allowed range.
For example:
Filter the anomaly, if the anomaly current value per hour is less than 1000 or larger than 2000, filter the anomaly.
filter:
- name: filter_rule_1
type: THRESHOLD_RULE_FILTER
params:
minValueHourly: 1000
maxValueHourly: 2000
Parameters:
| params | description | default value | supported values |
|---|---|---|---|
| minValueHourly | The minimum value allowed for an anomaly on an hourly bases. If the current value per hour in the anomaly duration is less than this value, filter the anomaly. | NaN | double values NaN means no threshold set. |
| maxValueHourly | The maximum value allowed for an anomaly on an hourly bases. If the current value per hour in the anomaly duration is larger than this value, filter the anomaly. | NaN | double values NaN means no threshold set. |
| minValueDaily | The minimum value allowed for an anomaly on a daily bases. If the current value per day in the anomaly duration is less than this value, filter the anomaly. | NaN | double values NaN means no threshold set. |
| maxValueDaily | The maximum value allowed for an anomaly on a daily bases. If the current value per day in the anomaly duration is larger than this value, filter the anomaly. | NaN | double values NaN means no threshold set. |
4. Anomaly duration filter (Type: DURATION_FILTER)
Filter the anomalies based on the anomaly duration.
Parameters:
| params | description | default value | supported values |
|---|---|---|---|
| minDuration | The minimum duration allowed for an anomaly. If the anomaly’s duration is less than this value, filter the anomaly. | null | String representation of Java duration. See examples here: |
| maxDuration | The maximum duration allowed for an anomaly. If the anomaly’s duration is larger than this value, filter the anomaly. | null | String representation of Java duration |
For example:
Filter the anomaly, if the anomaly duration is less than 15 minutes.
filter:
- name: filter_rule_1
type: DURATION_FILTER
params:
minDuration: PT15M
Please override the default merge configs in the YAML if the duration filter is set. Otherwise, it might have side effects.
merger:
maxGap: 0 # prevent potential anomaly duration extension
.._filter-absolutechange 5. Absolute change anomaly filter (Type: ABSOLUTE_CHANGE_FILTER) ~~~~~~~~~~~~~~~~~~~~~~~~~~~~~~~~~~~~~~~~~~~~~~~~~~~~~~~~~~~~~~~~~~~~~~
Check if the anomaly’s absolute change compared to baseline is above the threshold If not, filters the anomaly.
Example:
filter:
- name: filter_rule_1
type: ABSOLUTE_CHANGE_FILTER
params:
threshold: 0.1 # filter out all changes less than 10%
Parameters:
| params | description | default value | supported values |
|---|---|---|---|
| threshold | The percentage threshold. If the percentage change is below this threshold, filter the anomaly. | NaN | double values NaN means no threshold set. |
| offset | The baseline timeseries used to calculate the baseline value. | The default baseline used in detection algorithm. | * hoXh hour-over-hour data points with a lag of X hours
* doXd day-over-day data points with a lag of X days
* woXw week-over-week data points with a lag of X weeks
* moXm month-over-month data points with a lag of X months
* meanXU average of data points from the the past X units (hour, day, month, week), with a lag of 1 unit)
* medianXU median of data points from the the past X units (hour, day, month, week), with a lag of 1 unit)
* minXU minimum of data points from the the past X units (hour, day, month, week), with a lag of 1 unit)
* maxXU maximum of data points from the the past X units (hour, day, month, week), with a lag of 1 unit)
If this value is not set, it will use the default baseline. E.g, if the detection uses PERCENTAGE_RULE and offset is wo1w then the baseline is last week’s value. If the detection type is ALGORITHM then the baseline is generated by algorithm. |
| pattern | Keep as an anomaly if the metric drop, rise or both directions. | UP_OR_DOWN | UP: Keep the anomaly only if the current value is above the baseline and passes the threshold. DOWN: Keep the anomaly only if the current value is below the baseline and passes the threshold. UP_OR_DOWN: Keep the anomaly if it passes the threshold regardless of metric moving to which directions |
C. List of all supported Subscription group Types
1. Default Alerter (type: DEFAULT_ALERTER_PIPELINE)
The default notification type which lets you to configure a set of recipients and sends anomaly notification to all of them.
type: DEFAULT_ALERTER_PIPELINE
2. Dimension Alerter (type: DIMENSION_ALERTER_PIPELINE)
This gives you the ability to alert different people/group/team based on the dimension values. This is a special notification type which sends the anomaly email to a set of unconditional and another set of conditional recipients, based on the value of a specified anomaly dimension.
type: DIMENSION_ALERTER_PIPELINE
dimension: app_name
dimensionRecipients:
"android":
- "android-oncall@linkedin.com"
"ios":
- "ios-oncall@linkedin.com"
Didn’t Find the Detection Algorithm You Want? Contribute!
With the interfaces ThirdEye provide, it is not too difficult to add a new detection rule or algorithm.
When you are implementing, you can refer to thirdeye-pinot/src/main/java/org/apache/pinot/thirdeye/detection/components/HoltWintersDetector.java.
Contributions are highly welcomed. If you have any question, feel free to contact us.
1. Add Configuration Spec
Refer to thirdeye-pinot/src/main/java/org/apache/pinot/thirdeye/detection/spec/HoltWintersDetectorSpec
, add all the configurable parameters of the rule/algorithm.
2. Implement Detection Interfaces
Refer to thirdeye-pinot/src/main/java/org/apache/pinot/thirdeye/detection/components/HoltWintersDetector.java,
implements BaseLineProvider and AnomalyDetector interface accordingly.
BaseLineProvider has function computePredictedTimeSeries, which returns a TimeSeries that contains the predicted baseline and upper and lower bounds of the predicted baseline.
AnomalyDetector has function runDetection, which returns a list of anomalies detected by the algorithm/rule.
3. Preview Your Algorithm
In Create Alert detection configuration yaml, change the detection type to the type you specified in your detection class decorator.
Enter your params and try it out on any metric!
ThirdEye Architecture
Detection Pipeline Architecture
This document summarizes the motivation and rationale behind the 2018 refactoring of ThirdEye’s anomaly framework library. We describe critical user, dev, and ops pain points, define a list of requirements and discuss our approach to building a scalable and robust detection framework for ThirdEye. We also discuss conscious design trade-offs made in order to facilitate future modification and maintenance of the system.
Motivation
ThirdEye has been adopted by numerous teams for production monitoring of business and system metrics, and ThirdEye’s user base grows consistently. With this come challenges of scale and a demand for excellence in development and operation. ThirdEye has outgrown the assumptions and limits of its existing detection framework in multiple dimensions and we need to address technical debt in order to enable the on-boarding of new use-cases and continue to satisfy our existing customers. We experience several pain points with the current detection framework:
Lack of support for business rules and custom work flows
Anomaly detection workflows have many common components such as the monitoring of different metrics and the drill-down into multiple dimensions of time series. However, each individual detection use-case usually comes with an additional set of business rules to integrate smoothly with established processes at LinkedIn. These typically include cut-off thresholds and fixed lists of sub-dimensions to monitor or ignore, but may extend to custom alerting workflows and the grouping of detected anomalies for different sets of users. ThirdEye’s existing detection infrastructure is monolithic and prevents us from encoding business logic in a plug-able way.
Difficult debugging and modification
The existing framework has grown over multiple generations of developers with different preferences, designs, and goals. This lead to an inconsistent and undocumented approach to architecture and code design. Worse, existing design documentation is outdated and misleading. This is exacerbated by a lack of testing infrastructure, integration tests, and unit tests. Many assumptions about the behavior of the framework are implicit and only exist in the heads of past maintainers of platform code and algorithms. This makes modification of code extremely difficult as there aren’t any ways to estimate the impact of a proposed change to the detection framework before running the whole integrated system on production data.
Tight coupling prevents testing
Another property of the existing detection code base is tight coupling of individual components and the leaking of state in unexpected places, such as utility functions. It is not currently possible to unit test an individual piece, such as the implementation of an anomaly merger strategy, without setting up the entire system from caching and data layer, over scheduler and worker, to a populated database with pre-existing configuration and anomalies. The untangling of these dependencies is hampered by unnecessarily complex interfaces for anomaly detection functions that blend together aspects of database configuration, detection date ranges, multiple detection modes, merging of detected anomalies, and even UI visualization.
Low performance and limitations to scaling
The current implementation of detection, on-boarding, and tuning executes slowly. This is surprising given the modest amount of time series ingested and processed by ThirdEye, especially when considering that Pinot and Autometrics do the heavy lifting of data aggregation and filtering. This can be attributed to the serial retrieval of data points and redundant data base access, part of which is a consequence of the many stacked generations of designs and code. The execution of on-boarding and detection tasks takes several minutes rather than seconds. This leads to regular queue buildup in the system, and also gave rise to unnecessary complexity in the UI to inform users about task progress and its various delays and failure modes. For ThirdEye to scale to support large sets of system metrics or automatically monitor thousands of UMP metrics in parallel these bottlenecks must be eliminated.
Half-baked self-service and configuration capabilities
Configuration currently is specific to the chosen algorithm and no official front-end exists to manually modify detection settings. As a workaround users access and modify configuration directly via a database admin tool, which comes with its own set of dangers and pitfalls. While the database supports JSON serialization, the detection algorithms currently use their own custom string serialization format that is inaccessible even to advanced users. Additionally, the feedback cycle for users from re-configuring an alert (or creating a new one) to ultimately evaluating its detection performance is long and requires manual cleanup and re-triggering of detection by algorithm maintainers.
No ensemble detection or multi-metric dependencies
Some users prefer execution of rules and algorithms in parallel, using algorithms for regular detection but relying on additional rules as fail-safe against false negatives. Also, detection cannot easily incorporate information from multiple metrics without encoding this functionality directly into the algorithm. For example, site-wide impact filters for business metrics are currently part of each separate algorithm implementation rather than modular, re-usable components.
No sandbox support
On-boarding, performance tuning, and re-configuration of alerts are processes that involve iterative back-testing and to some degree rely on human judgement. In order for users to experiment with detection settings, the execution of algorithms and evaluation of rules must be sandboxed from affecting the state of the production system. Similarly, integration testing of new components may require parallel execution of production and staging environments to build trust after invasive changes. The current tight coupling of detection components in ThirdEye makes this impossible.
Requirements
An architecture is only as concise as its requirements. After running ThirdEye for metric monitoring in production for over a year, many original assumptions changed and new requirements came in. In the following we summarize the requirements we deem critical for moving ThirdEye’s detection capabilities onto a robust and scalable new foundation.
De-coupling of components
Components of the detection framework must be separated to a degree that allows testing of individual units and sandboxed execution of detection workflows. Furthermore, contracts (interfaces) between components should be minimal and should not pre-impose a structure that is modeled after specific use-cases.
Full testability
Every single part of the detection pipeline must be testable as a unit as well as in integration with others. This allows us to isolate problems a in individual components and avoid regressions via dedicated tests. We must alos provide test infrastructure to mock required components with simple implementations of existing interfaces. This testability requirement also serves as verification step of our efforts to decouple components.
Gradual migration via emulation of existing anomaly interface
ThirdEye has an existing use-base that has built trust in existing detection methods and tweaked them to their needs, and hence, support for legacy algorithms via an emulation layer is a must-have. It is near impossible to ensure perfect consistency of legacy and emulated execution due to numerous undocumented behavioral quirks. Therefore, the emulation layer will be held to a minimum. Additionally, as we migrate users’ workflows to newer implementations this support will be phased out.
Simple algorithms should be simple to build, test, and configure
Simple algorithms and rules must be easy to implement, test, and configure. As a platform ThirdEye hosts different types of algorithms and continuously adds more. In order to scale development to both a larger team of developers and collaborators, development of custom workflows and algorithms must be kept as as friction-less as possible.
Support multiple metrics and data sources in single algorithm
Several use-cases require information from several metrics and metric-dimensions at once to reliably detect and classify anomalies. Our framework needs native support for this integration of data from multiple sources. This includes multiple metrics, as well as other sources such as external events, past anomalies, etc.
Use-case specific workflows and logic
Most detection use-cases bring their own domain-specific business logic. These processes must be encoded into ThirdEye’s detection workflows in order to integrate with existing processes at LinkedIn and enable the on-boarding of additional users and teams. This integration of business logic should be possible via configuration options in the majority of cases, but will eventually require additional plug-able code to execute during detection and alerting workflows.
Don’t repeat yourself (code and component re-use)
With often similar but not perfectly equal workflows there is a temptation to copy code sequences for existing algorithms and re-use them for new implementations. This redundancy leads to code bloat and the duplication of mistakes and should be avoided to the maximum degree possible. Code re-use via building blocks and utilities correctly designed to be stateless in nature must be a priority.
Consistent configuration of algorithms (top-level and nested)
The mechanism for algorithm configuration should be uniform across different implementations. This should be true also for nested algorithms. As ThirdEye already uses JSON as serialization format for data base storage, configuration should be stored in a compatible way. While we note JSON is not the best choice for human read-able configuration it is the straight-forward choice given the existing metadata infrastructure.
Stateless, semi-stateful, stateful execution
Algorithms can exist in multiple environments. A stateless sandbox environment, a semi-stateful sandbox environment that has been prepared with data such as pre-existing anomalies, and the production environment in which the database keeps track of results of previous executions. The algorithm implementation should be oblivious to the executing harness to the maximum extent possible.
Interactive detection preview and performance tuning for users
As part of the on-boarding workflow and tuning procedure, ThirdEye allows users to tweak settings - either manually or via automated parameter search. This functionality should support interactive replay and preview of detection results in order to help our users build trust in and improve on the detection algorithm or detection rules. This is primarily a performance requirement as is demands execution of newly-generated detection rules at user-interactive speeds. Furthermore, this interactive preview can serve as a test bed for algorithm maintainers and developers to build new algorithms and debug existing ones.
Flow parallelism
Multiple independent detection flows must execute in parallel and without affecting each other’s results. Sub-task level parallelism is out of scope.
Architecture
We split the architecture of ThirdEye in three layers: the execution layer, the framework layer, and the logic layer. The execution layer is responsible for tying in the anomaly detection framework with ThirdEye’s existing task execution framework and provide configuration facilities. The framework layer provides an abstraction for algorithm development by providing an unified interface for data and configuration retrieval as well as utilities for common aspects involved in algorithm development. It also provides the contract for the low-level detection pipeline that serves as foundation for any specialized algorithms and pipelines built on top. The logic layer implements business logic and detection algorithms. It also contains the implementation of wrapper pipelines for common tasks such as dimension exploration and anomaly merging that can be used in conjunction with different types of detection detection algorithms.

Execution layer
The execution layer ties in the detection framework with ThirdEye’s existing task execution framework and data layer. ThirdEye triggers the execution of detection algorithms either time-based (cron job) or on-demand for testing or per on-boarding request from a user. The scheduled execution executes per cron schedule in a stateful manner such that the result of previous executions is available to the algorithm on every run. This component is especially important as it serves most production workloads of ThirdEye. The sandbox executor triggers on demand an can choose to either execute from a clean slate or use a copy past exhaust data generated by the scheduled executor. Results can either be discarded or retained, thus enabling state-less, semi-stateful, and stateful execution. Finally, the test executor runs on-demand with a user-specified input set and allows unit- and integration-testing of higher-level implementations.
Framework layer
The framework provides an abstraction over various data sources and configuration facilities in ThirdEye and presents a uniform layer to pipeline and algorithm developers. A major aspect of this is the Data Provider, which encapsulates time-series, anomaly, and meta-data access. Furthermore, there are helpers for configuration injection and utilities for common aspects of algorithm development, such as time-series transformations and the data frame API. The framework layer also manages the life cycle of detection algorithms from instantiation, configuration, and execution to result collection and tear down. It’s primary contract is the Detection Pipeline, which serves as a foundation of all higher-level abstractions.
Logic layer
The business logic layer builds on the framework’s pipeline contract to implement detection algorithms and specialized pipelines that share functionality across groups of similar algorithms. A special aspect of the business logic layer are wrapper pipelines which enable implementation and configuration of custom detection workflows, such as the exploration of individual dimensions or the domain-specific merging of anomalies with common dimensions. The framework pipelines supports this functionality by supporting nested execution of pipelines with configuration injected from wrapping pipelines and user-configuration.
Design decisions and trade-offs
“Simple algorithms should be simple to build” vs “arbitrary workflows should be possible”
Our detection framework provides a layered pipeline API to balance simplicity and flexibility in algorithm and workflow development. We chose to provide two layers: the raw “DetectionPipeline” and the safer “StaticDetectionPipeline”. The raw pipeline layer allows dynamic loading of data and iterative execution of nested code, which enables us to implement arbitrary workflows but comes at the cost higher complexity and placing the burden of performance optimization on the developer. The static pipeline serves as a safe alternative that implements a single round-trip of specifying required data through the algorithm and retrieving the data in one pass from the framework. The static pipeline covers the vast majority of use cases and simplifies algorithm development. We tie both layers together by enabling raw pipelines to seamlessly execute nested algorithms, such as those implemented via the static pipeline interface, thus enabling safe development of algorithms as the nodes of a workflow with arbitrary edges in between them.
“De-coupling” vs “simple infrastructure”
Simplicity and testability stand at the core of the refactoring of the anomaly detection framework. De-coupling of components is strictly necessary to enable unit testing, however, a separation of the framework into dozens of individual components makes the writing of algorithms and test-cases confusing and difficult, especially as it introduces various partial-failure modes. The data provider shows this trade-off between loose coupling and one-stop simplicity: rather than registering individual data connectors and referencing the loosely by name, the data provider uses a statically defined interface to contains accessors to any available type of input data. This clearly specifies the contract, but also requires that new data sources be added via code-change rather than configuration. Additionally, the test infrastructure (the mock provider) must immediately implement this new data source. Should the number of available data sources grow significantly, this design decision should be revisited.
“batch detection” vs “point-wise walk forward”
The detection pipeline contract was designed to handle time ranges rather than single timestamps. This enables batch operations and multi-period detection scenarios but offloads some complexity of implementing walk-forward analysis onto the maintainers of algorithms that perform point-wise anomaly detection. At the current state this is mainly an issue with legacy detection algorithms and we address it by providing a specialized wrapper pipeline that contains a generic implementation of the walk-forward procedure. In case there are several new algorithms that require walk-forward detection, this legacy wrapper should generalized further.
“complex algorithms” vs “performance and scalability”
Our architecture currently does not enforce any structure on the algorithm implementation besides the specification of inputs and outputs. Specifically, there are no limits on the amount of data that can be requested from the provider. This enables algorithm maintainers to implement algorithms in non-scalable ways, such as re-training the detection model on long time ranges before each evaluation of the detection model. It also doesn’t prevent the system (and its data sources) from mistakes of algorthm developers or configuration errors.
Another limitation here is the restriction of parallelism on a per-flow basis. Pipelines and algorithms can contain internal state during execution which is not stored in any external meta data store. This enables algorithm developers to create arbitrary logic, but restricts parallelism to a single serial thread of execution per flow in order to avoid the complexity of synchronization and distributed processing.
“nesting and non-nesting configuration” vs “implicit coupling via property key injection”
There is a fundamental trade-off between separately configuring individual metric- or dimension-level alerts and setting up a single detector with overrides specific to a single sub-task of detection. Furthermore, this configuration may be injected from a wrapper pipeline down into a nested pipeline. We explicitly chose to use a single, all-encompassing configuration per detection use-case to allow consistent handling of related anomalies in a single flow, for example for merging or clustering. This introduces the need to support configuration overrides in wrapper-to-nested property injection.
“generalized configuration object” vs “static type safety of config”
Configuration of pipelines could be served as statically defined config classes or semi-structured (and dynamically typed) key-value maps. Static objects provide type-safety and would allow static checking of configuration correctness. They add overhead for pipeline development and code however. The alternative delays error checking to runtime, i.e. only when the configured pipeline is instantiated and executed. This approach is more lightweight and flexible in terms of development. When the configuration structure changes, static typing introduces increasing overhead for maintaining support for multiple versions of valid configuration objects while semi-structured configuration pushes this issue to the developer of the pipeline. We specifically chose the semi-structured approach.
“atomic execution” vs “redundant computation”
Anomaly detection isn’t a purely online process, i.e. detection sometimes changes its decisions about the past state of the world after detection already on this past time range. For example, a new but short short outlier may be ignored by detection initially, but may be re-classified as an anomaly when the following data points are generated and show similar anomalous behavior. ThirdEye’s legacy detection pipeline chose to store both “candidates” and “confirmed” anomalies in the data base. This initially removed the need to re-compute candidate anomalies for merging and re-classification since they could all be retrieved from the database. However, depending on the part of the application only part of all these anomalies were surface which lead to inconsistent handling in back- and front-end and confused developers and users alike. Furthermore, storing all potential anomalies lead to extreme database bloat (400%+) and the intended compute savings did not materialize as back-filled data and run time errors in detection tasks made cleanup and re-computation of anomalies necessary anyways. The new detection framework explicitly chooses an atomic execution model where anomalies either materialize or not. This comes at the cost of having to re-compute a longer time period (several days) in addition to any newly added time range to find all potential candidates for merging. Given that all current algorithms already retrieve several weeks worth of training data for each detection run this overhead is negligible.
“serial execution, custom and re-usable wrappers” vs “parallel execution pipeline parts”
Parallelism in ThirdEye performs on job level, but not per task. This allows users to specify arbitrary flows of exploration, detection, merging, and grouping tasks as all the state is available in a single place during execution (see atomic execution above). The trade-off here comes from a limit to scaling of extremely large singular detection flows that cannot execute serially. This can be mitigated by splitting the job into multiple independent ones, effectively allowing the user to choose between execution speed and flow complexity.
Detection Pipeline Execution Flow
Background & Motivation
Current detection pipeline does not support business rules well. The user-base of ThirdEye is growing constantly. A lot of anomaly detection use-case comes with an additional set of business rules. For example, growth team want to filter out the anomalies whose site-wide impact is less than a certain threshold. They need to group anomalies across different dimensions. Some teams want to set up anomaly detection using threshold rules or want to use a fixed list of sub-dimensions to monitor or ignore. In the current pipeline, to satisfy one specific business logic requirement, the pipeline flow has to be updated because the anomaly pipeline is monolithic and does not allow customized business rule plugins. Moreover, the current pipeline is lack of testing infrastructure. There is no testability of any pipeline change, this making changes extremely hard.
Users also have no way to configure their business rule without reaching out to the pipeline maintainer to change the config JSON manually, which is not scalable. Some users, although has their specific inclusion/exclusion rules, still want to utilize the auto-tuned algorithm-based detection pipeline. This is not achievable in the current pipeline.
Due to the limitations described above, we introduce the composite pipeline flow in the new detection pipeline framework to achieve the following goals:
- More flexibility of adding user-defined business rules into the pipeline
- User-friendly configuration of the detection rules
- Robustness and testability
Design & Implementation
Composite pipeline flow
The pipeline is shown as follows.

Dimension Exploration:
Dimension drill down for user-defined dimensions. For example, explore county dimension where continent = Europe.
Dimension Filter:
Filter out dimensions based on some business logic criteria. For example, only explore the dimension whose contribution to overall metric > 5%.
Rule Detection:
User specified rule for anomaly detection. For example, if percentage change WoW > 10%, fires an anomaly.
Algorithm Detection:
Existing anomaly detection algorithms. Such as sign test, spline regression, etc.
Algorithm alert filter:
Existing auto-tune alert filters.
Merger:
For each dimension, merge anomalies based on time. See more detailed discussion about merging logic below.
Rule filter:
Exclusion filter for anomalies defined by user to filter out the anomalies they don’t want to receive. For example, if within the anomaly time range, the site wide impact of this metric in this dimension is less than 5% , don’t classify this as an anomaly .
Grouper:
Groups anomalies across different dimensions.
The algorithm detection and alert filter will provide backward-compatibility to existing anomaly function interface.
For each stage, we provides interfaces so that they can be pluggable. User can provide any kind of business logic to customized the logic of each stage. The details of the interfaces are listed in this page: Detection pipeline interfaces.
Pros of this pipeline:
- Users can defines inclusion rules to detect anomalies.
- Users won’t receive the anomalies they explicitly filtered out if they set up the exclusion rule-based filter.
- For each dimension, users won’t see duplicated anomalies generated by algorithm & rule pipeline for any time range, since they are merged based on time.
Alternative Pipeline flow designs:

Pros of this pipeline:
- Users can defines inclusion rules to detect anomalies.
- Users won’t receive the anomalies they explicitly filtered out if they set up the exclusion rule-based filter.
- Users won’t see duplicated anomalies generated by algorithm & rule pipeline, since they are merged based on time.
Cons of this pipeline:
- The algorithm alert filter might filter out the anomalies generated by user specified rules, i.e. users could miss anomalies they want to see.

Pros of this pipeline:
- Users can defines inclusion rules to detect anomalies.
- Users won’t see duplicated anomalies generated by algorithm & rule pipeline, since they are merged based on time.
Cons of this pipeline:
- Users will still see the anomaly they set rules to explicitly filter out. Because the anomalies generated by algorithm detection pipeline does not filtered by user’s exclusion rule.
As discussed above, we recommend to use the first discussed design as default. The detection framework itself still has the flexibility of executing different type of flows if this is needed later.
Merging logic
Merging happens either when merging anomalies within a rule/algorithm detection flow or merge anomalies generated by different flows. Merger’s behavior is slightly different in these two conditions.
Merging only rule-detected anomalies or rule-detected anomalies
Do time-based merging only. Do not keep anomalies before merging.
Merging both rule-detected anomalies and algorithm-detected anomalies
There will be 3 cases when merging two anomalies:

Solution to case 2:
In this example, will send A-D as the anomaly.
Pros:
- Users will not receive duplicated anomaly for any specific range.
- Improves the recall.
Cons:
- Users will receive an extended anomaly range. More period to investigate
In this example, will send C-B as the anomaly.
Pros:
- User will not receive duplicated anomaly for any specific range.
- Improved the precision. The anomaly range is shortened. User has less period to investigate.
Cons:
- User could miss the anomaly period he explicitly set rule to detect. Because the merger might chop off the anomaly period. Reduce the recall.
In this example, will send A-B and C-D as two anomalies.
Pros:
- Improves the recall
Cons:
- User will receive duplicated anomaly for a specific time range, in this example for C-B.
- User has more workload to investigate because of more anomalies
As discuss above, we set merger to behave like solution 1 by default, i.e, merger merges the time period. The merger will keep the anomalies before merging as the child anomalies. This allows tracing back to the anomalies generated by different algorithms/rules.