Quick Start
ThirdEye supports an interactive demo mode for the analysis dashboard. These steps will guide you to get stepsarted.
1: Prerequisites
You’ll need Java 8+, Maven 3.6+, and NPM 3.10+
2: Build ThirdEye
git clone https://github.com/apache/incubator-pinot.git
cd incubator-pinot/thirdeye
chmod +x install.sh run-frontend.sh run-backend.sh reset.sh
./install.sh
Note: The build of thirdeye-frontend may take several minutes
3: Run frontend
./run-frontend.sh
4: Start an analysis
Point your favorite browser to
http://localhost:1426/app/#/rootcause?metricId=1
Note: ThirdEye in demo mode will accept any credentials
You will find the root cause analysis page like below:

5: Have fun
Available metrics in demo mode are:
- business::puchases
- business::revenue
- tracking::adImpressions
- tracking::pageViews
Note: These metrics are regenerated randomly every time you launch ThirdEye in demo mode
We also have 2 real world metric with seasonality in H2 database, for detection experimentation:
- H2::daily (From: https://www.kaggle.com/marklvl/bike-sharing-dataset)
- H2::hourly (From: https://www.kaggle.com/robikscube/hourly-energy-consumption)
6: Run detection preview
A detection preview let you see how the detection configuration performs on past data.
Copy the following into the detection configuration:
detectionName: name_of_the_detection

description: If this alert fires then it means so-and-so and check so-and-so for irregularities

metric: value

dataset: H2.H2.daily

rules:
- detection:
    - name: detection_rule_1
      type: HOLT_WINTERS_RULE
      params:
        sensitivity: 8
Click Run Preview button, the anomalies will be detected. Then you can play around with different time frames.
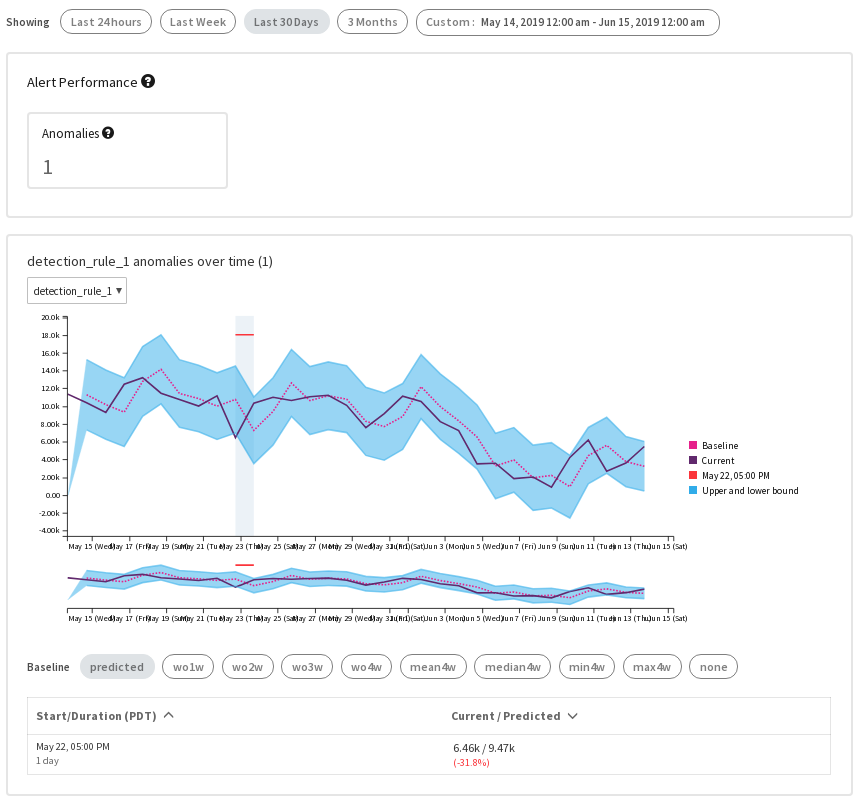
You will find the alert preview page like below:
If you want to preview the hourly data, just change dataset: H2.H2.daily to dataset: H2.H2.hourly, and rerun the preview.
If you want to setup in production, you need to see Configuration and Alert Setup.
7: Shutdown
You can stop the ThirdEye dashboard server anytime by pressing Ctrl + C in the terminal